In Part 5, I added Kali and Metasploitable. In this part, I add the first visibility layer: Wazuh as the lab SIEM.
The goal is to centralize security telemetry without trying to monitor everything at once. I start with the Wazuh server, a Docker host agent, Docker event collection, and pfSense syslog forwarding.
What I Built
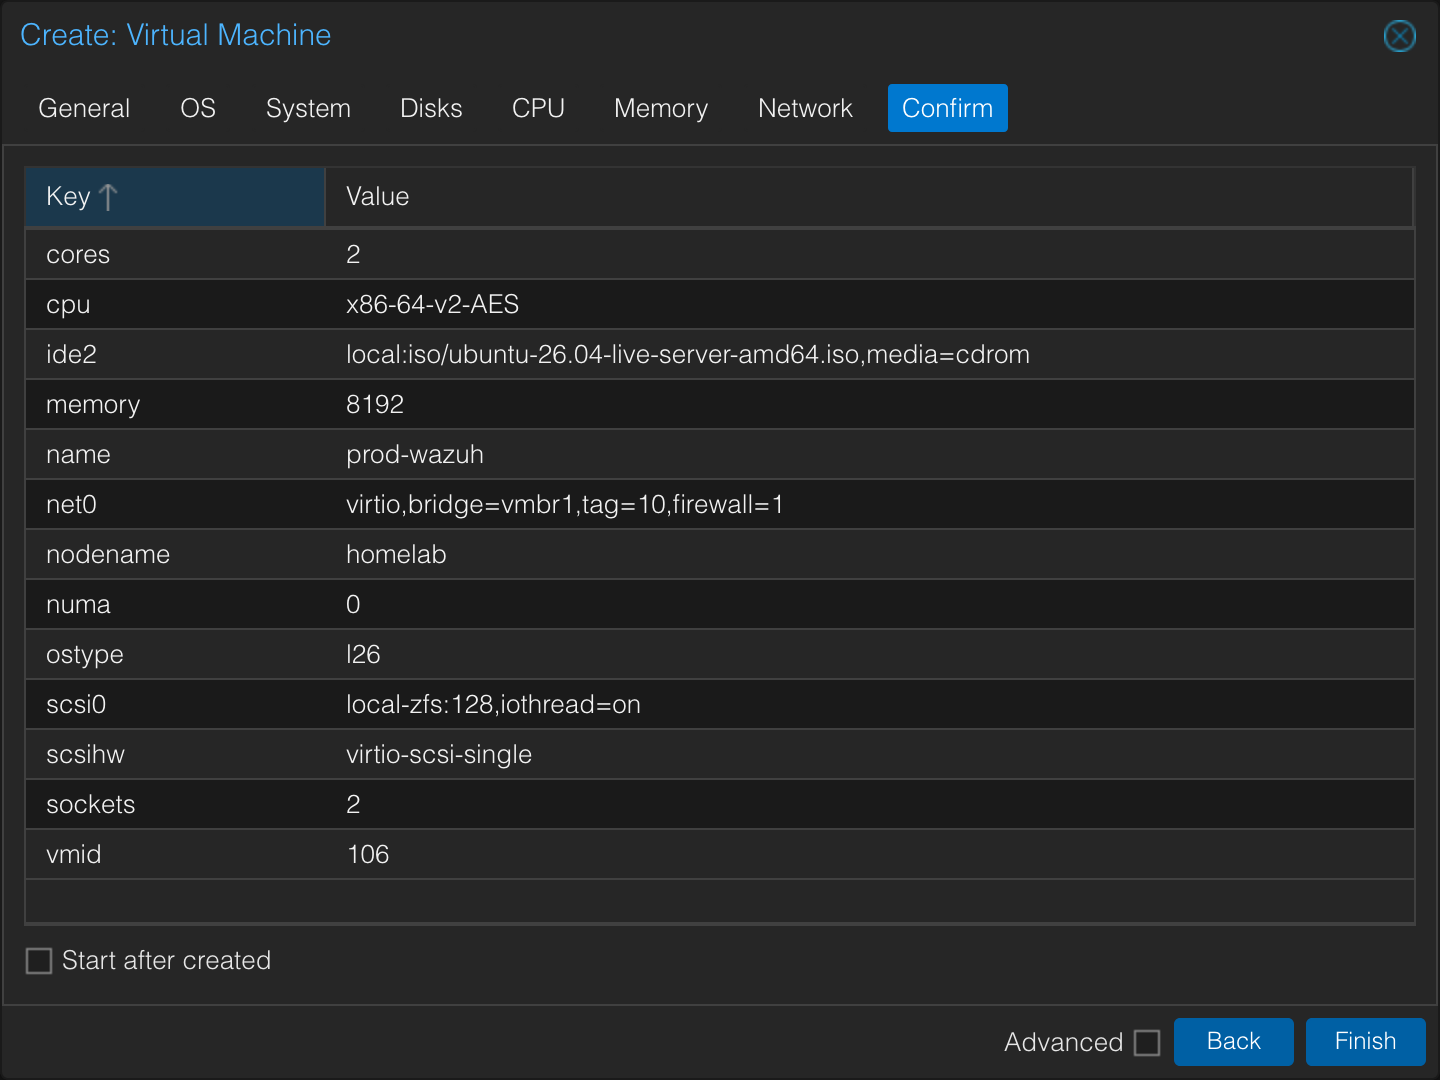
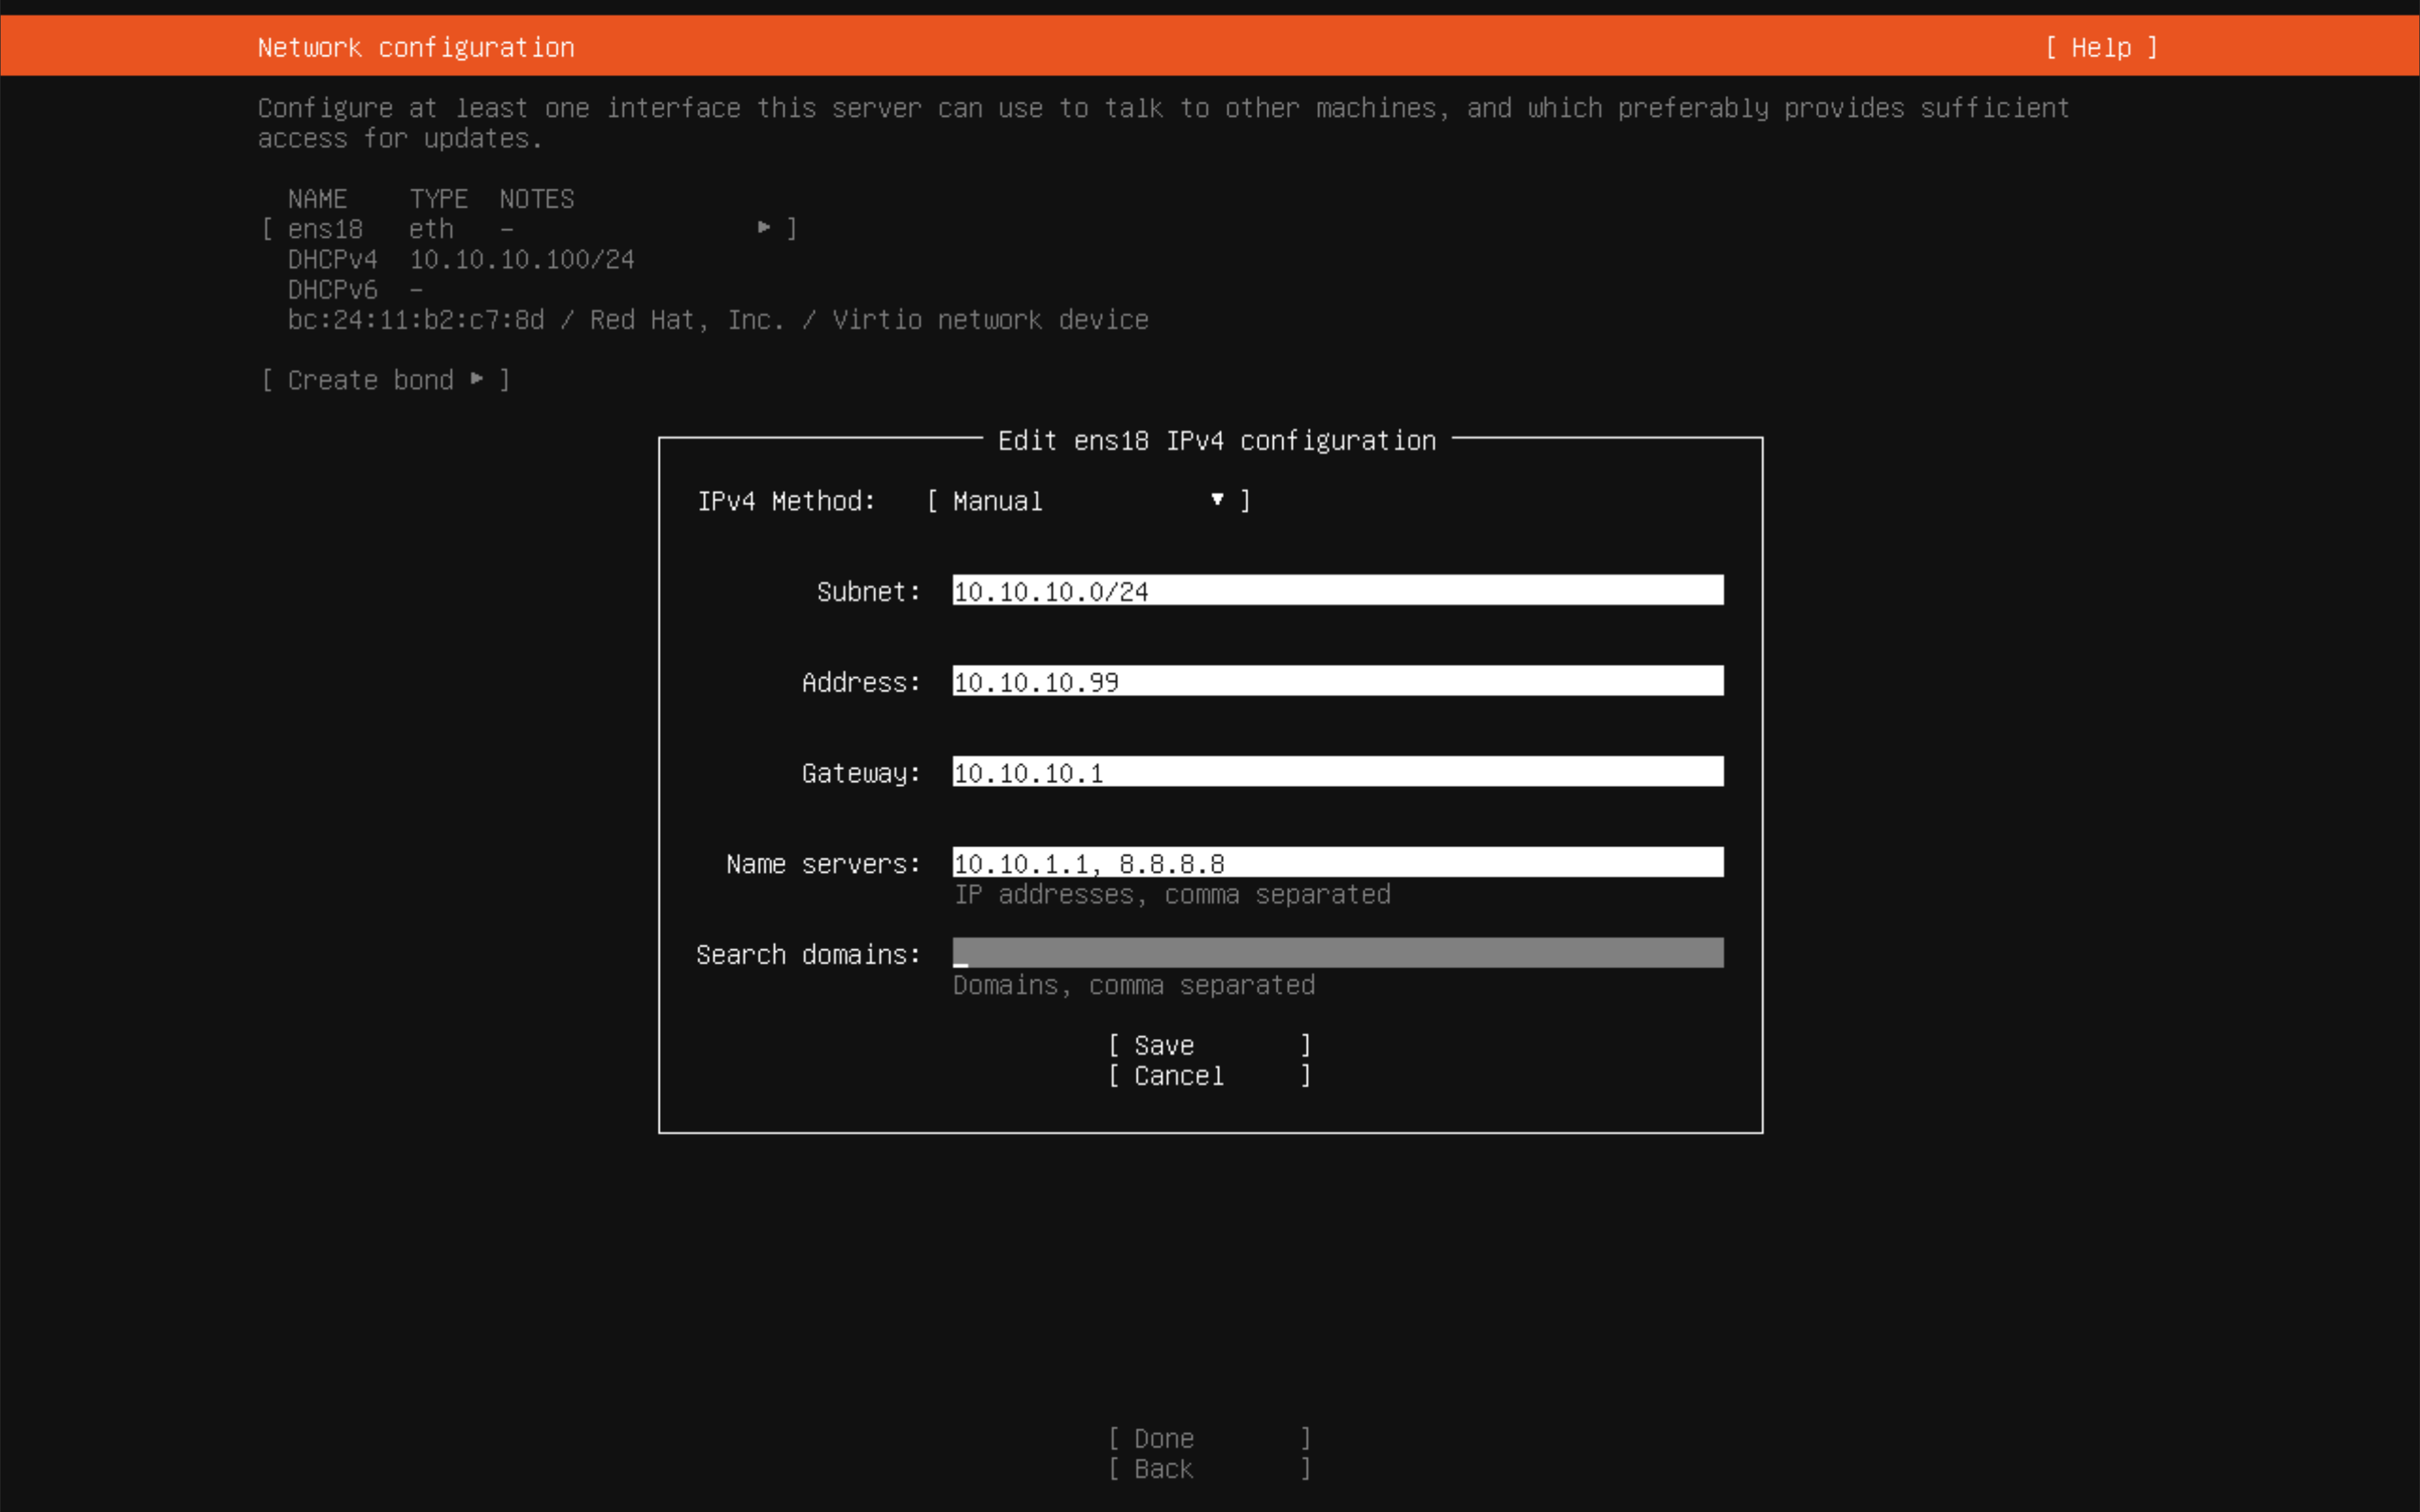
Wazuh VM:       10.10.10.99
Segment:        SIEM / VLAN 10
RAM:            8 GB
CPU:            4 vCPU
Disk:           128 GB
Agent target:   Docker host at 10.10.30.100
Syslog source:  pfSense
Why This Matters
The lab should not only run attacks. It should also show what those attacks and system changes look like in logs.
Wazuh becomes the place where I can later test questions like:
Did Sysmon catch this technique?
Did Snort send the alert?
Did a Docker service restart?
Did pfSense record the flow?
This post is the plumbing. Later posts can tune detections on top of it.
Topology Slice
Docker host 10.10.30.100 -- Wazuh agent --> Wazuh 10.10.10.99
pfSense ------------------ syslog UDP 514 --> Wazuh 10.10.10.99
Kali and Metasploitable deliberately do not get agents. I want attacker and target noise to be observed from network and target logs, not by installing a defensive agent on the attacker box.
Build Steps
Install Wazuh All-in-One
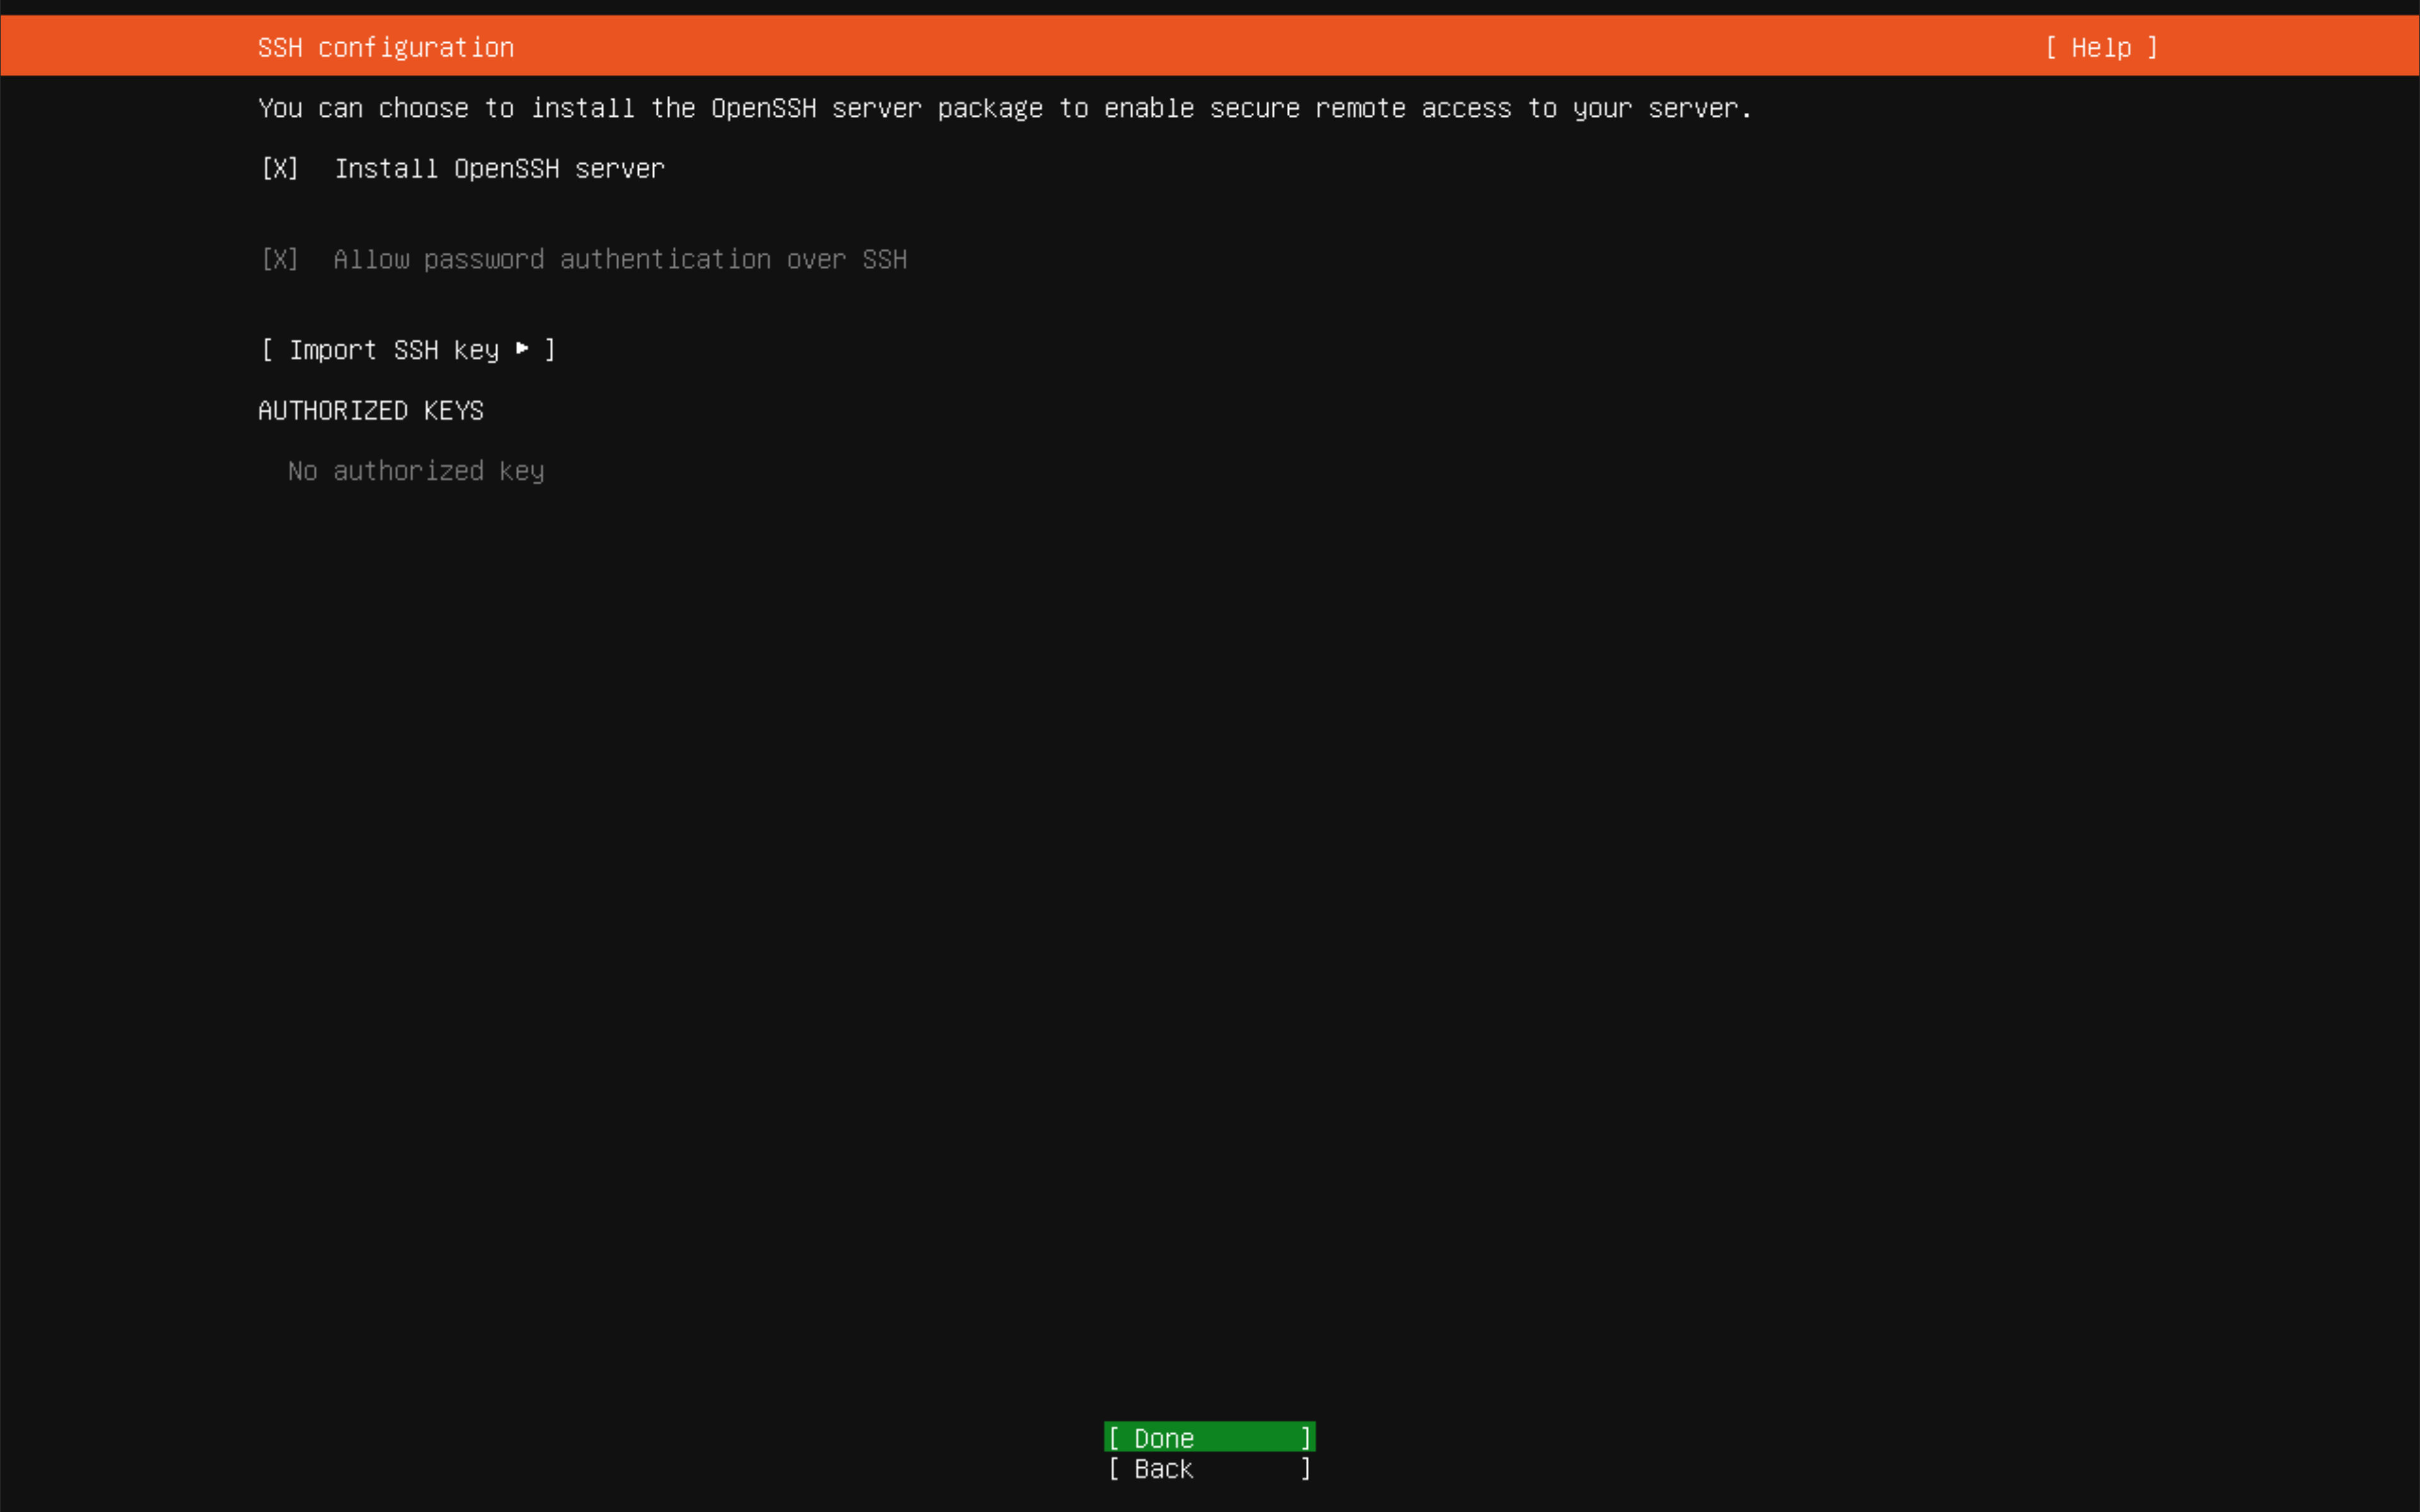
Access through the jumpbox:
ssh -J admin@10.10.1.50 plumy@10.10.10.99
sudo apt update && sudo apt upgrade -y
curl -sO https://packages.wazuh.com/4.14/wazuh-install.sh
sudo bash ./wazuh-install.sh -a
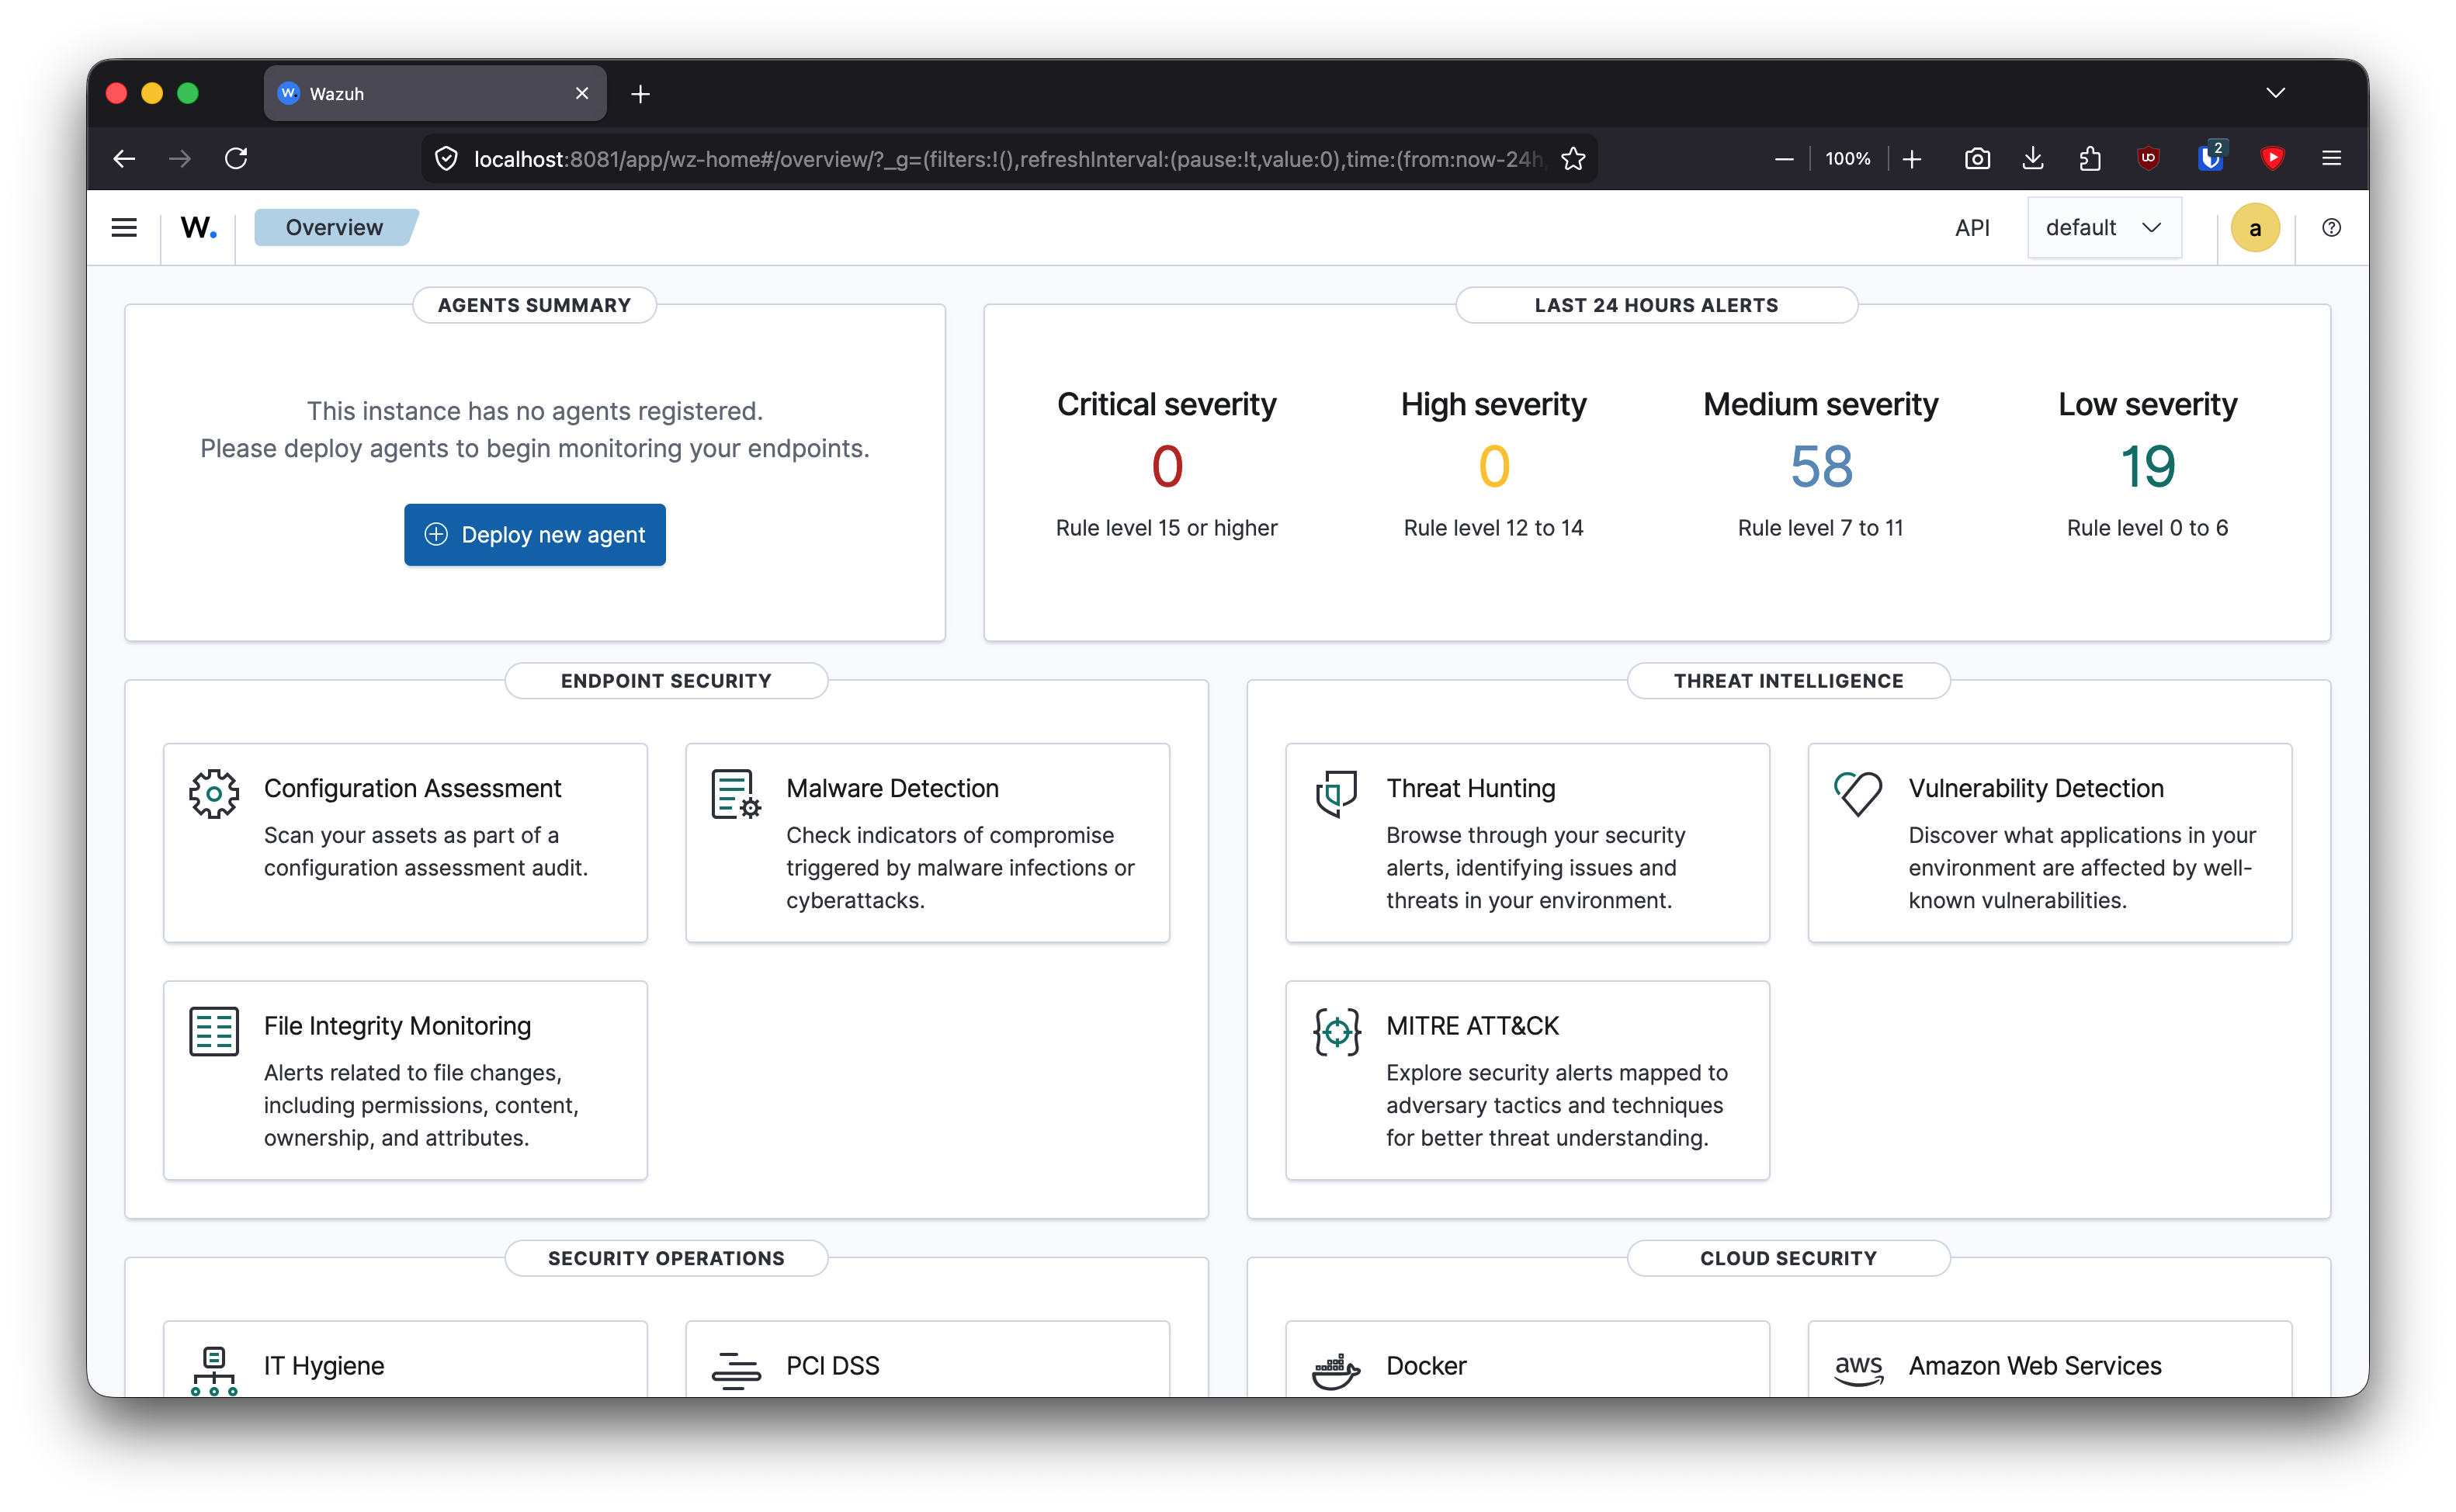
The installer prints the dashboard URL and the generated admin password at the end.
Install the Wazuh Agent on Docker Host
On the Docker host:
sudo su
apt-get install -y gnupg apt-transport-https
curl -s https://packages.wazuh.com/key/GPG-KEY-WAZUH | gpg --no-default-keyring \
  --keyring gnupg-ring:/usr/share/keyrings/wazuh.gpg --import
chmod 644 /usr/share/keyrings/wazuh.gpg

echo "deb [signed-by=/usr/share/keyrings/wazuh.gpg] https://packages.wazuh.com/4.x/apt/ stable main" \
  | tee -a /etc/apt/sources.list.d/wazuh.list
apt-get update
WAZUH_MANAGER="10.10.10.99" apt-get install -y wazuh-agent
systemctl daemon-reload
systemctl enable --now wazuh-agent
Enable Docker event collection in /var/ossec/etc/ossec.conf:
<wodle name="docker-listener">
  <disabled>no</disabled>
  <attempts>5</attempts>
  <run_on_start>yes</run_on_start>
  <interval>10m</interval>
</wodle>
Allow the agent user to read Docker events:
sudo usermod -aG docker wazuh
sudo systemctl restart wazuh-agent
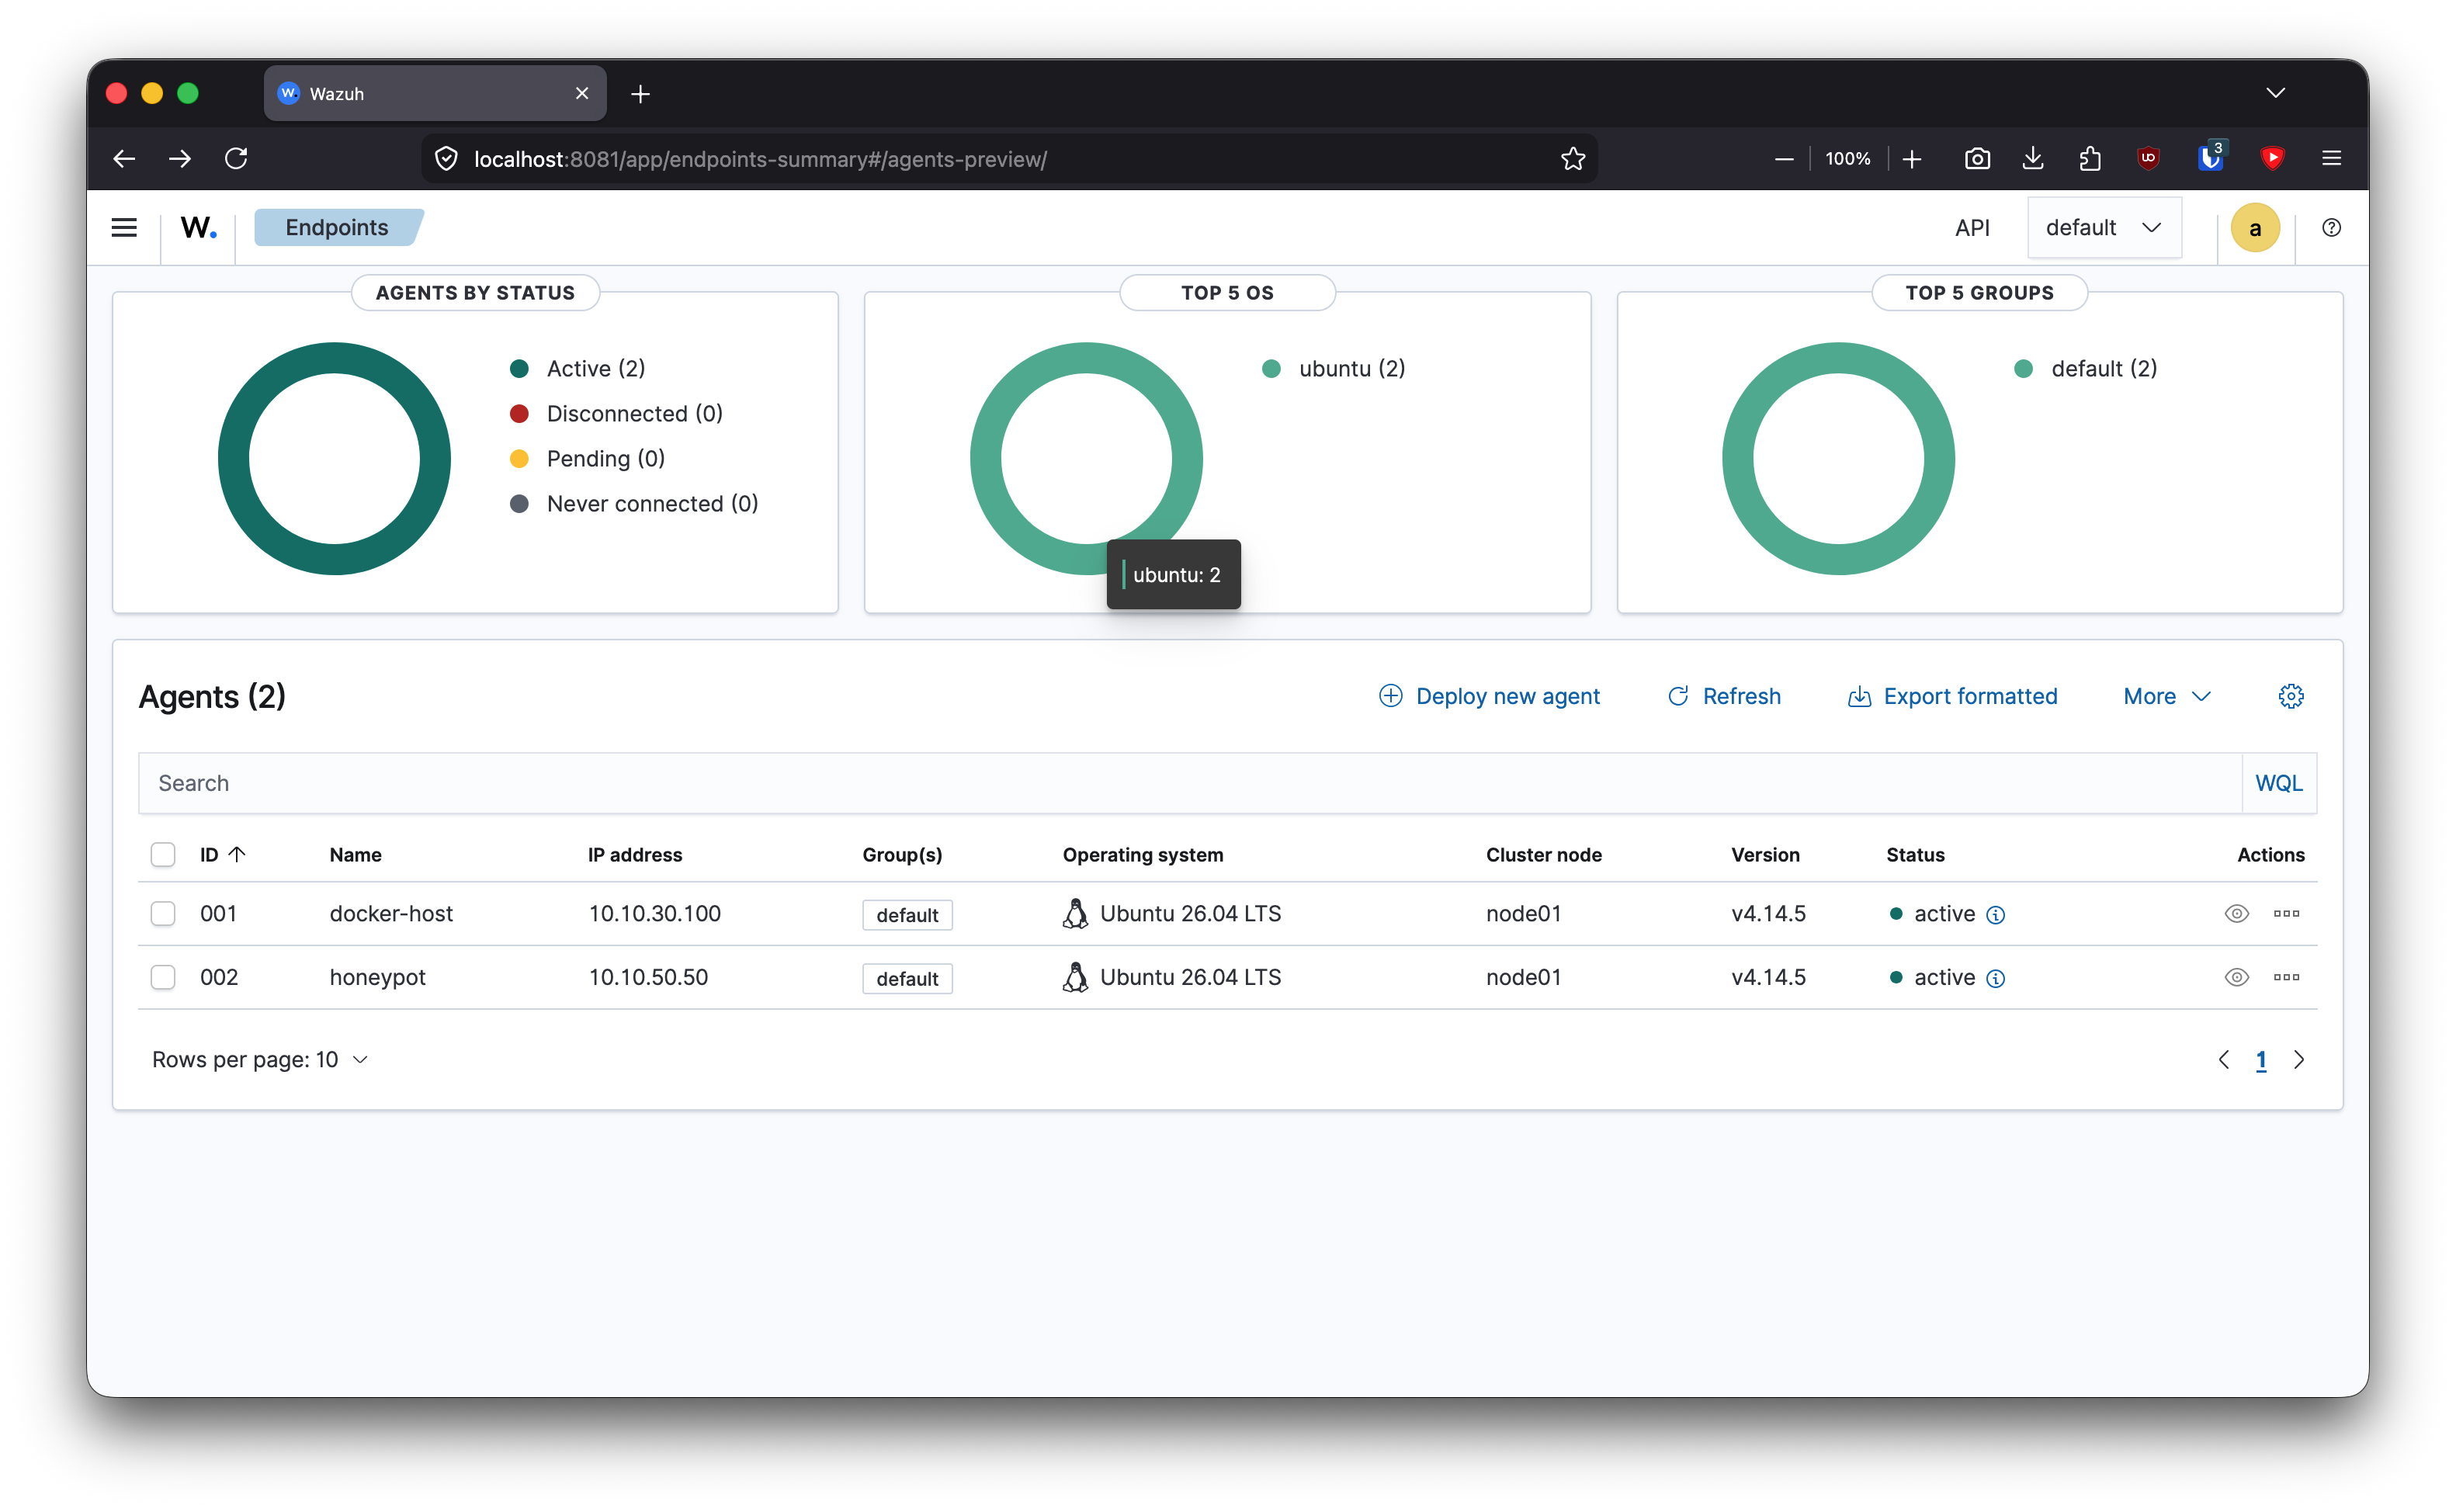
Fix Empty Docker Events
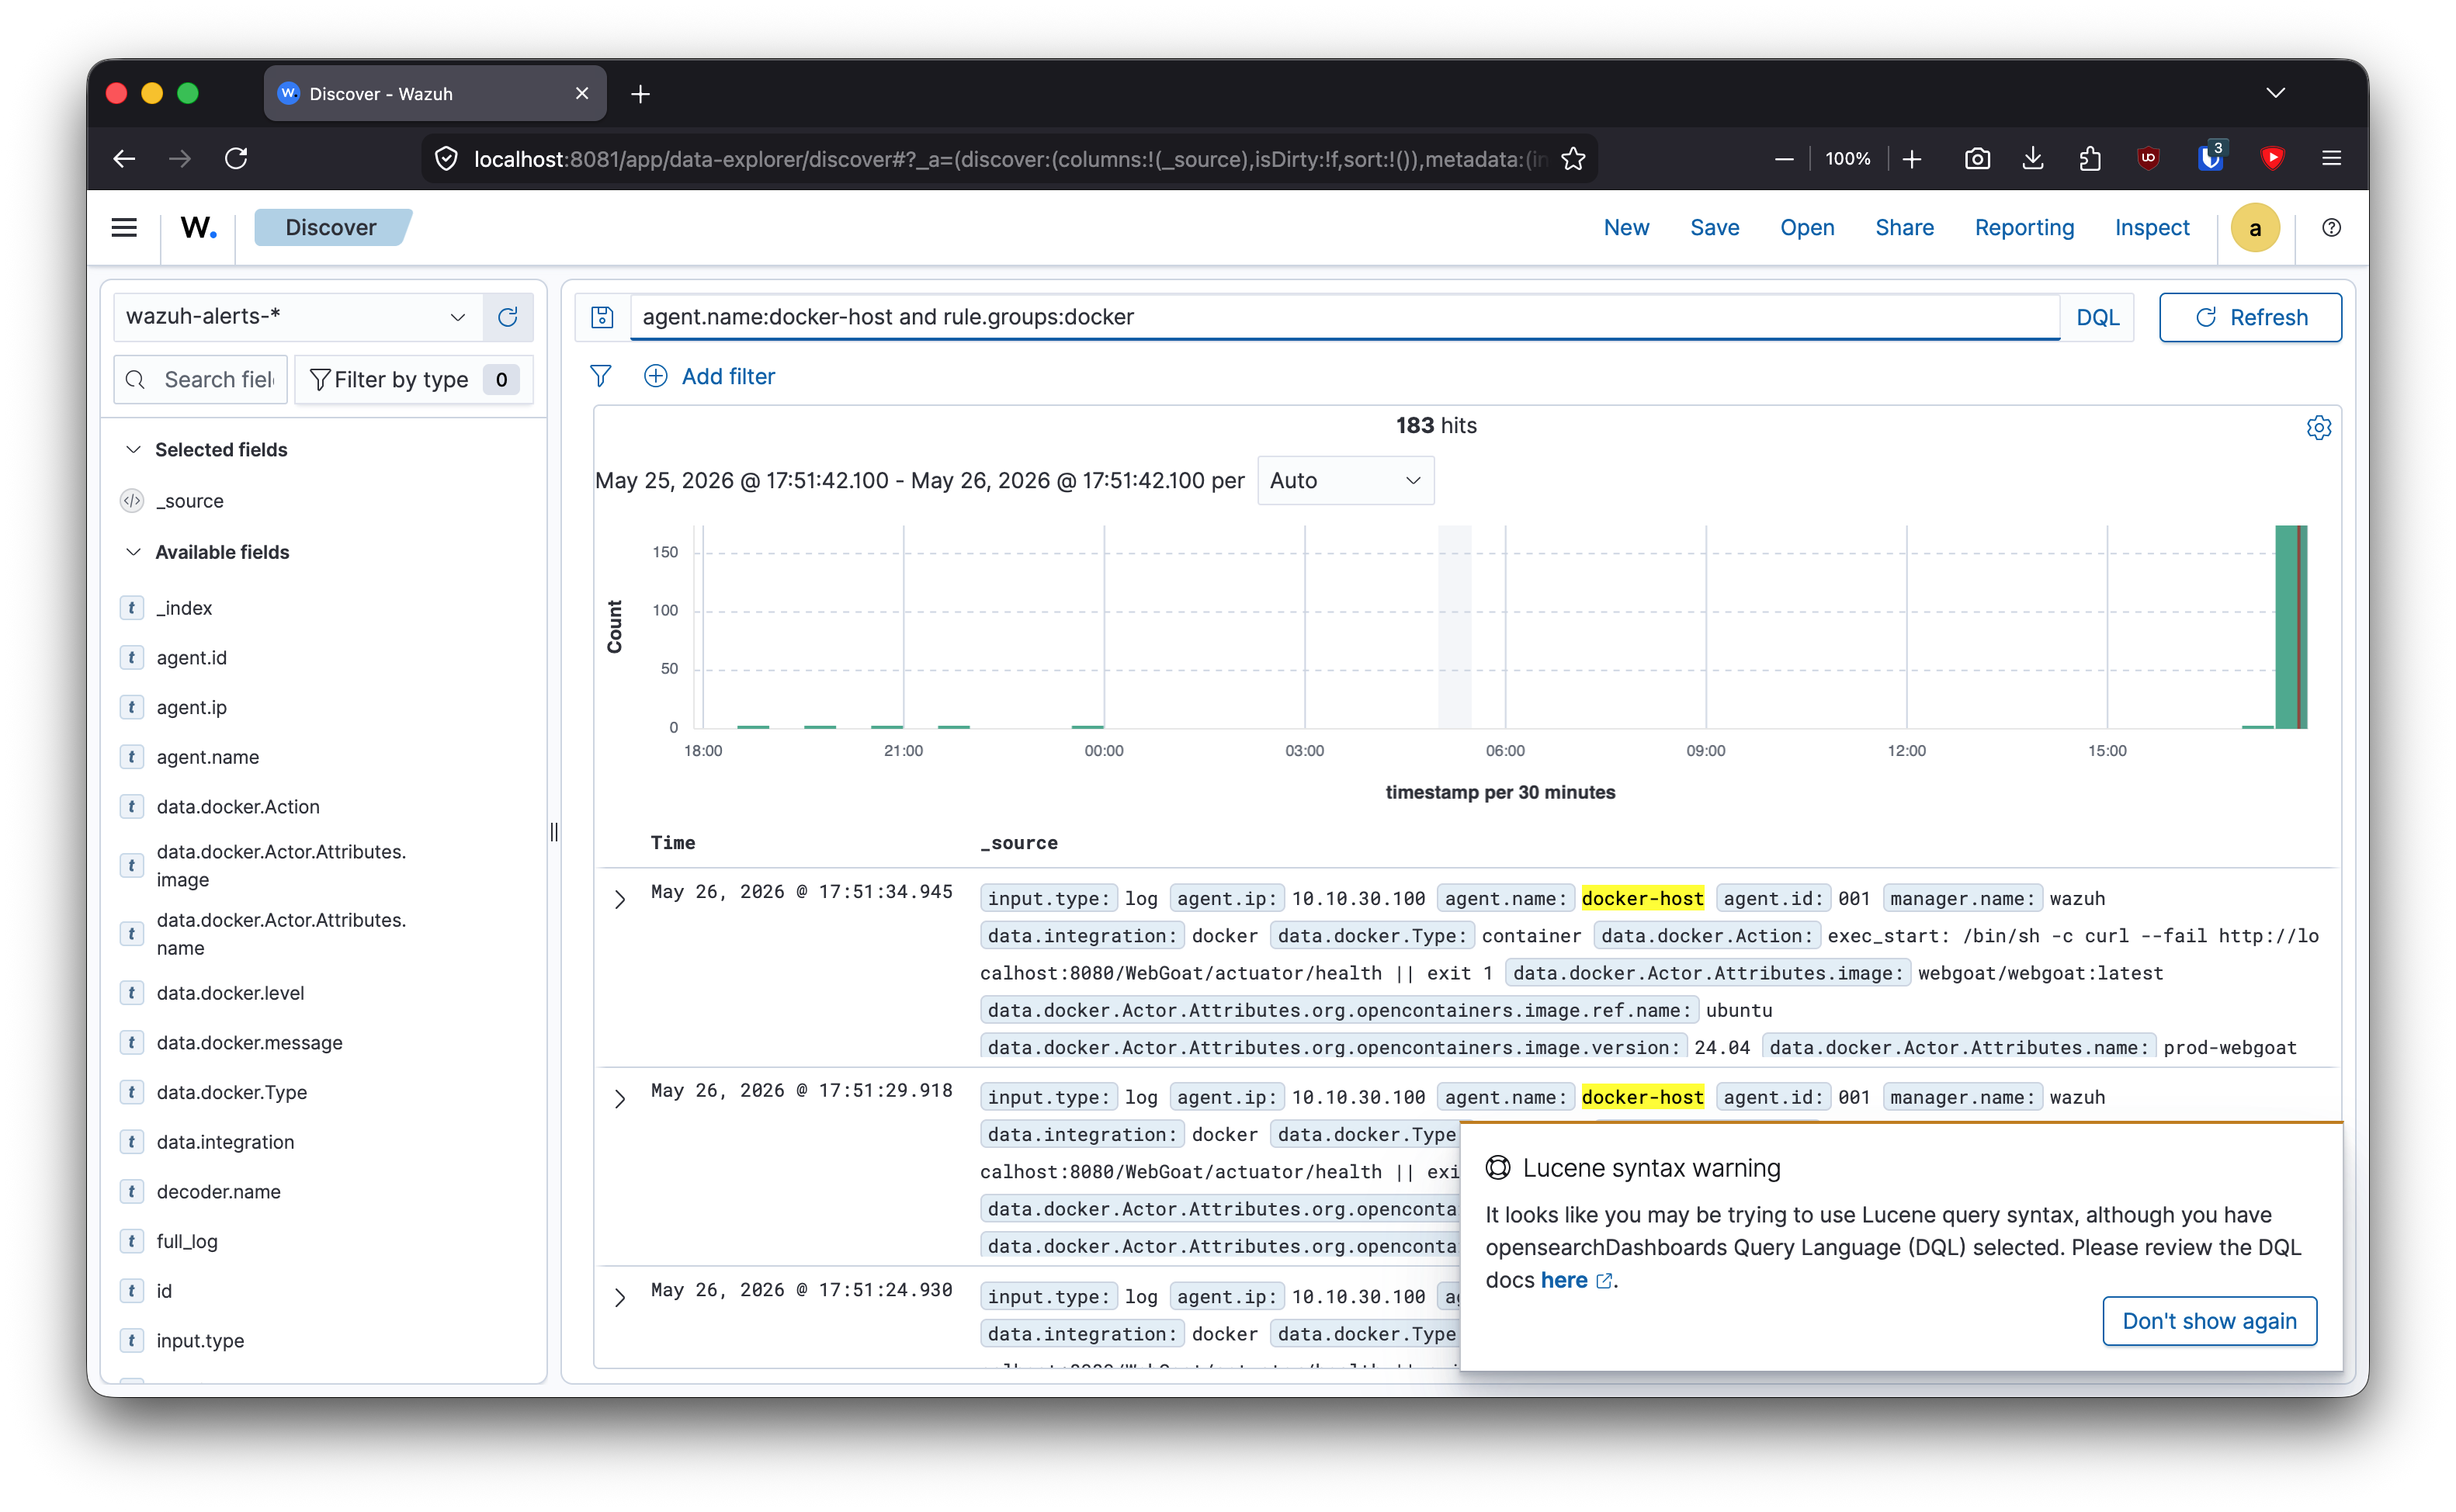
The Docker listener appeared to start, but structured Docker events were empty. The missing dependency was the Python Docker module on the agent host.
python3 -c "import docker; print(docker.__version__)"
# ModuleNotFoundError means the dependency is missing
sudo apt update
sudo apt install -y python3-docker
sudo systemctl restart wazuh-agent
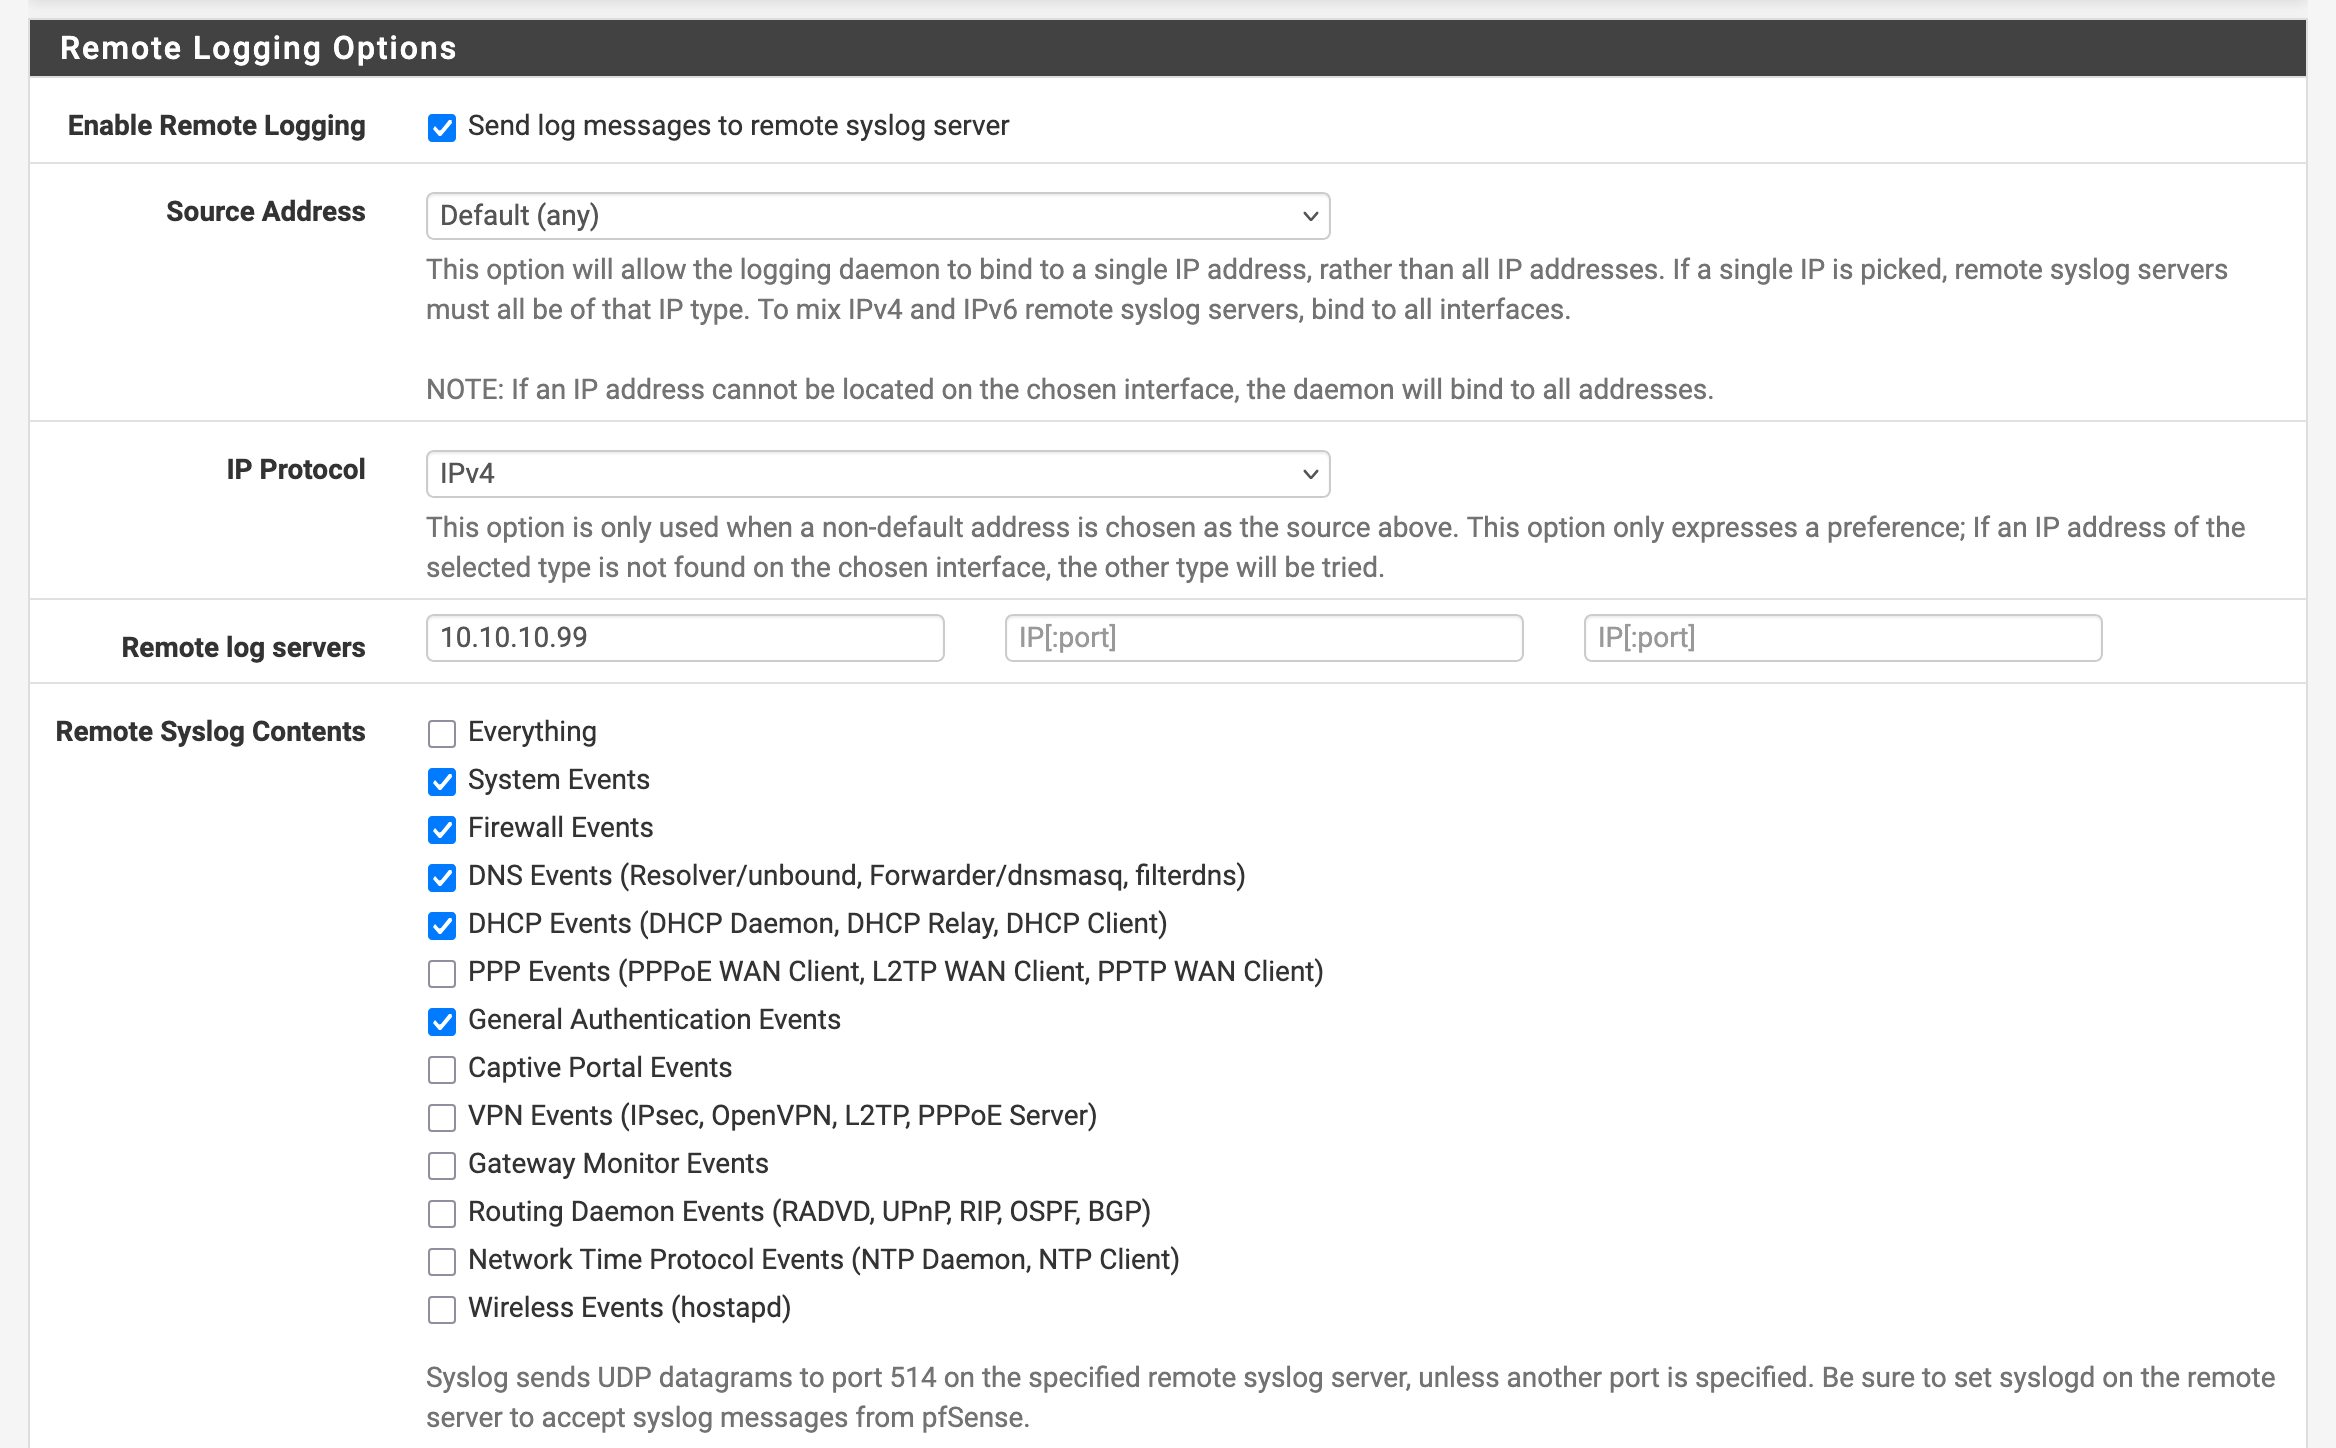
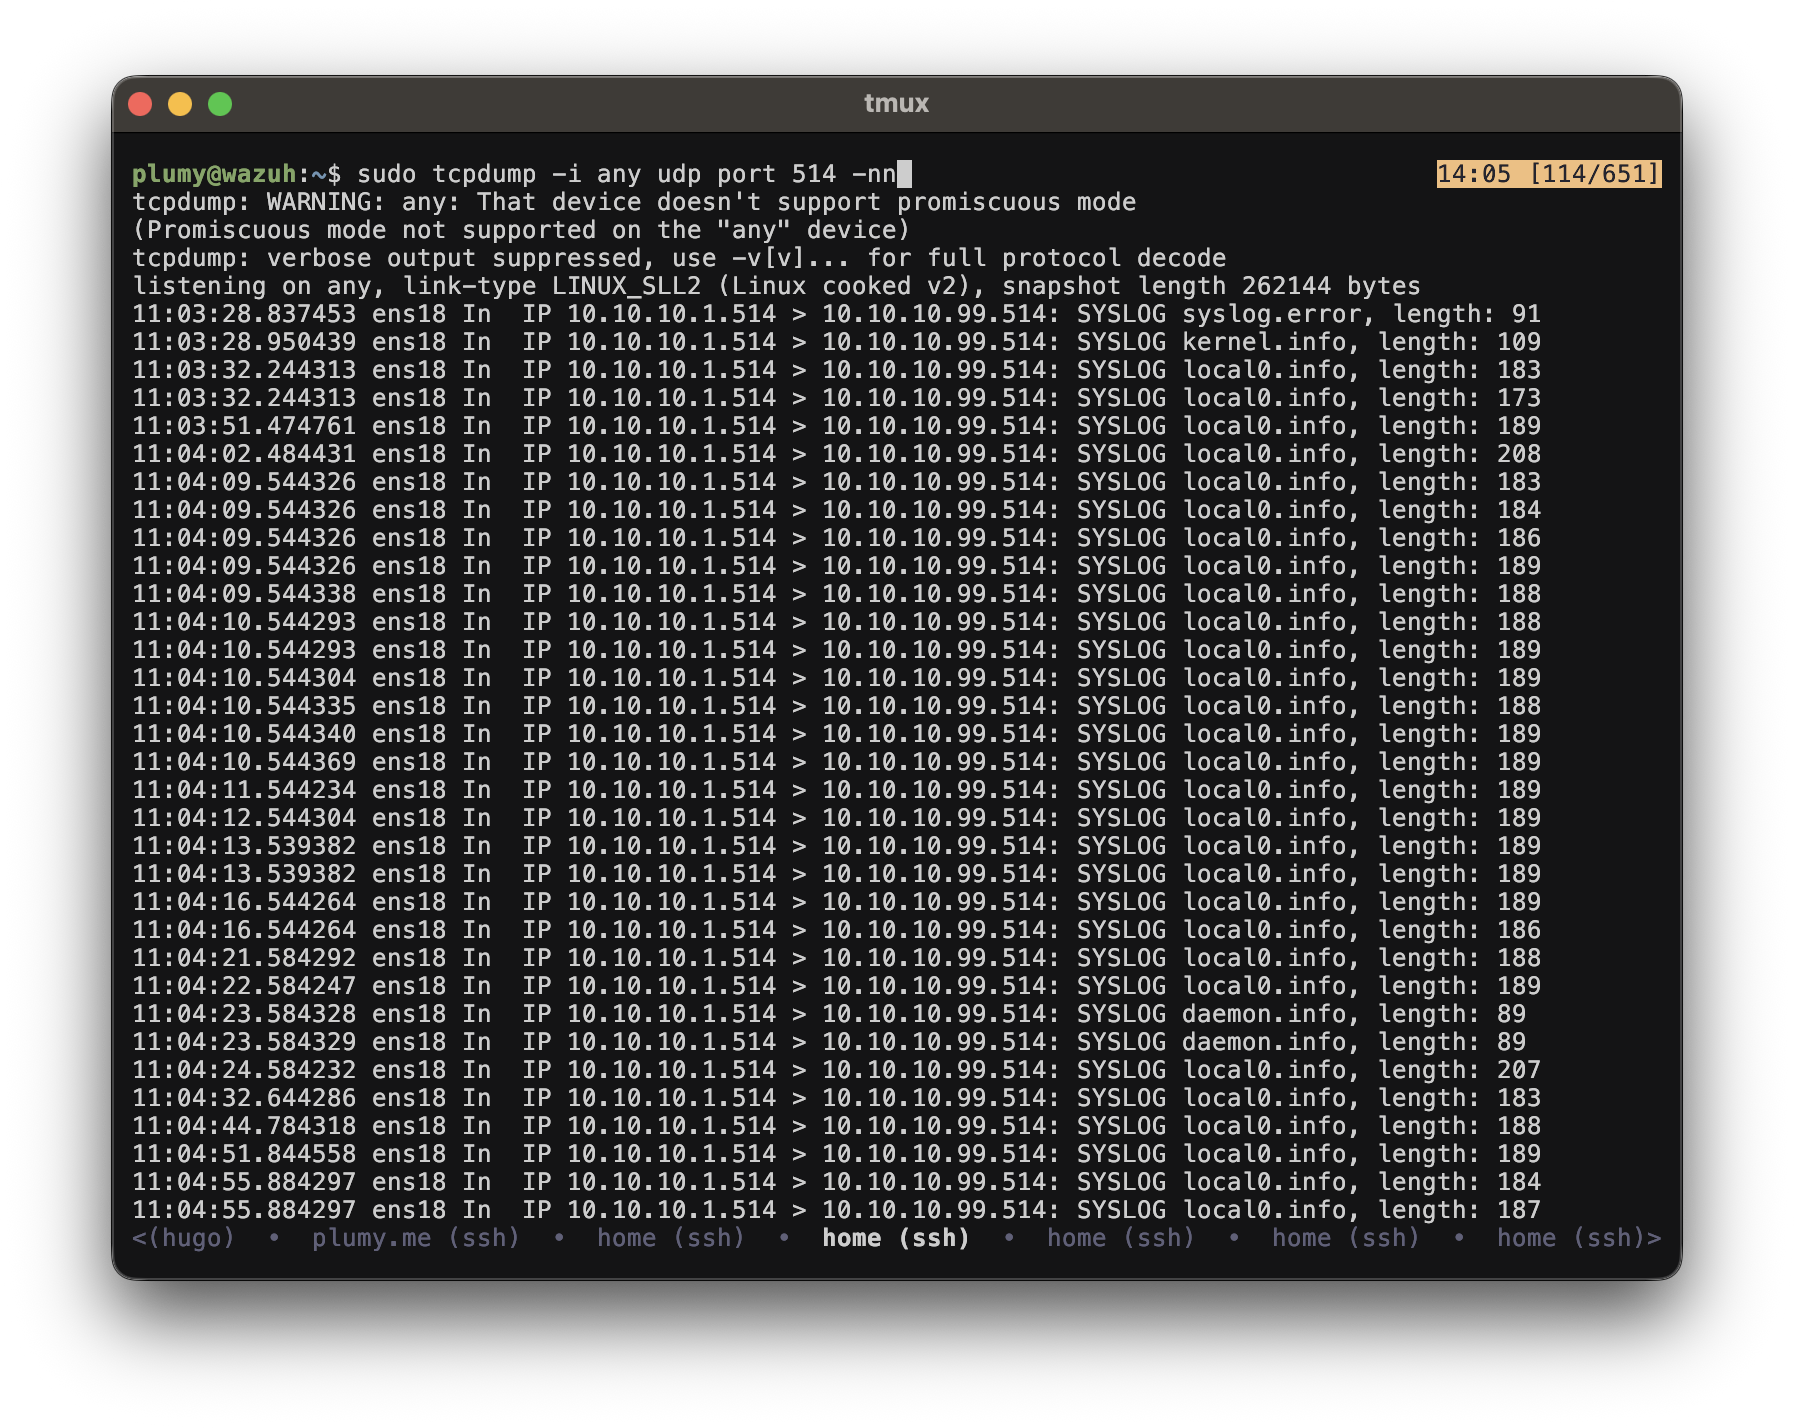
Forward pfSense Logs by Syslog
pfSense does not run a Wazuh agent in this lab. I forward its logs over syslog.
On Wazuh manager, add a remote syslog listener in /var/ossec/etc/ossec.conf:
<remote>
  <connection>syslog</connection>
  <port>514</port>
  <protocol>udp</protocol>
  <allowed-ips>10.10.0.0/16</allowed-ips>
  <local_ip>10.10.10.99</local_ip>
</remote>
Restart the manager:
sudo systemctl restart wazuh-manager
Then configure pfSense remote logging and restart syslogd from pfSense services.
Problems I Hit
Wazuh needed more RAM than I first wanted. 4 GB was not comfortable for the all-in-one stack. 8 GB made dashboard searches usable.
Docker listener said it started but produced no structured events. Installing python3-docker on the agent host fixed it.
pfSense syslog ordering mattered. If Wazuh restarts, I restart pfSense syslogd after the listener is back up.
What I Learned
Collection is not the same as visibility. A log source can be configured, a service can say it is running, and the dashboard can still show nothing useful. I need to validate each stage: collection, decoding, indexing, and search.
This is also where the value of segmentation started to show up. Wazuh lives in SIEM, Docker lives in CONTAINER, and pfSense routes between them. The telemetry path is explicit instead of accidental.
Validation Evidence
sudo systemctl status wazuh-manager
sudo systemctl status wazuh-agent
sudo tail -f /var/ossec/logs/archives/archives.log
Docker event test:
docker restart portainer
Wazuh queries:
agent.name:prod-docker
data.docker.Action:*
What This Enables Next
With the SIEM foundation working, I can add higher-value sensors: Snort on pfSense and T-Pot honeypot telemetry. That turns the lab from “systems with logs” into a place where attack activity can be observed and understood.
Quick Reference
curl -sO https://packages.wazuh.com/4.14/wazuh-install.sh
sudo bash ./wazuh-install.sh -a
<remote>
  <connection>syslog</connection>
  <port>514</port>
  <protocol>udp</protocol>
  <allowed-ips>10.10.0.0/16</allowed-ips>
  <local_ip>10.10.10.99</local_ip>
</remote>
sudo apt install -y python3-docker
sudo systemctl restart wazuh-agent