In Part 6, Wazuh started collecting Docker and pfSense logs. In this part, I add detection and deception: Snort on pfSense and T-Pot in the HONEYPOT VLAN.
The goal is to generate useful security telemetry, not just run tools. Snort alerts need to reach Wazuh, T-Pot attack logs need to be parsed, and I need to understand why dashboards can look empty even when events exist.
What I Built
Snort:        pfSense package, IDS mode
Interfaces:   WAN and LAN
Rules:        Community + focused ET Open categories
Honeypot:     T-Pot in VLAN 50
Telemetry:    T-Pot Suricata eve.json -> Wazuh agent
Test source:  Kali in VLAN 40
Why This Matters
This is where the lab starts behaving like a detection environment. I can generate traffic from Kali, catch it with network sensors, and check whether the SIEM receives useful fields.
The real lesson was not “install Snort.” The real lesson was tracing an event through the pipeline:
packet -> Snort alert -> pfSense system log -> Wazuh syslog listener -> decoder -> rule -> searchable event
Topology Slice
Kali 10.10.40.102  ->  HONEYPOT VLAN 50  ->  T-Pot 10.10.50.x
        |
        |-- test traffic

pfSense Snort -> pfSense syslog -> Wazuh 10.10.10.99
T-Pot agent -> Wazuh 10.10.10.99
T-Pot Suricata eve.json -> Wazuh localfile JSON
Build Steps
Install and Configure Snort
On pfSense:
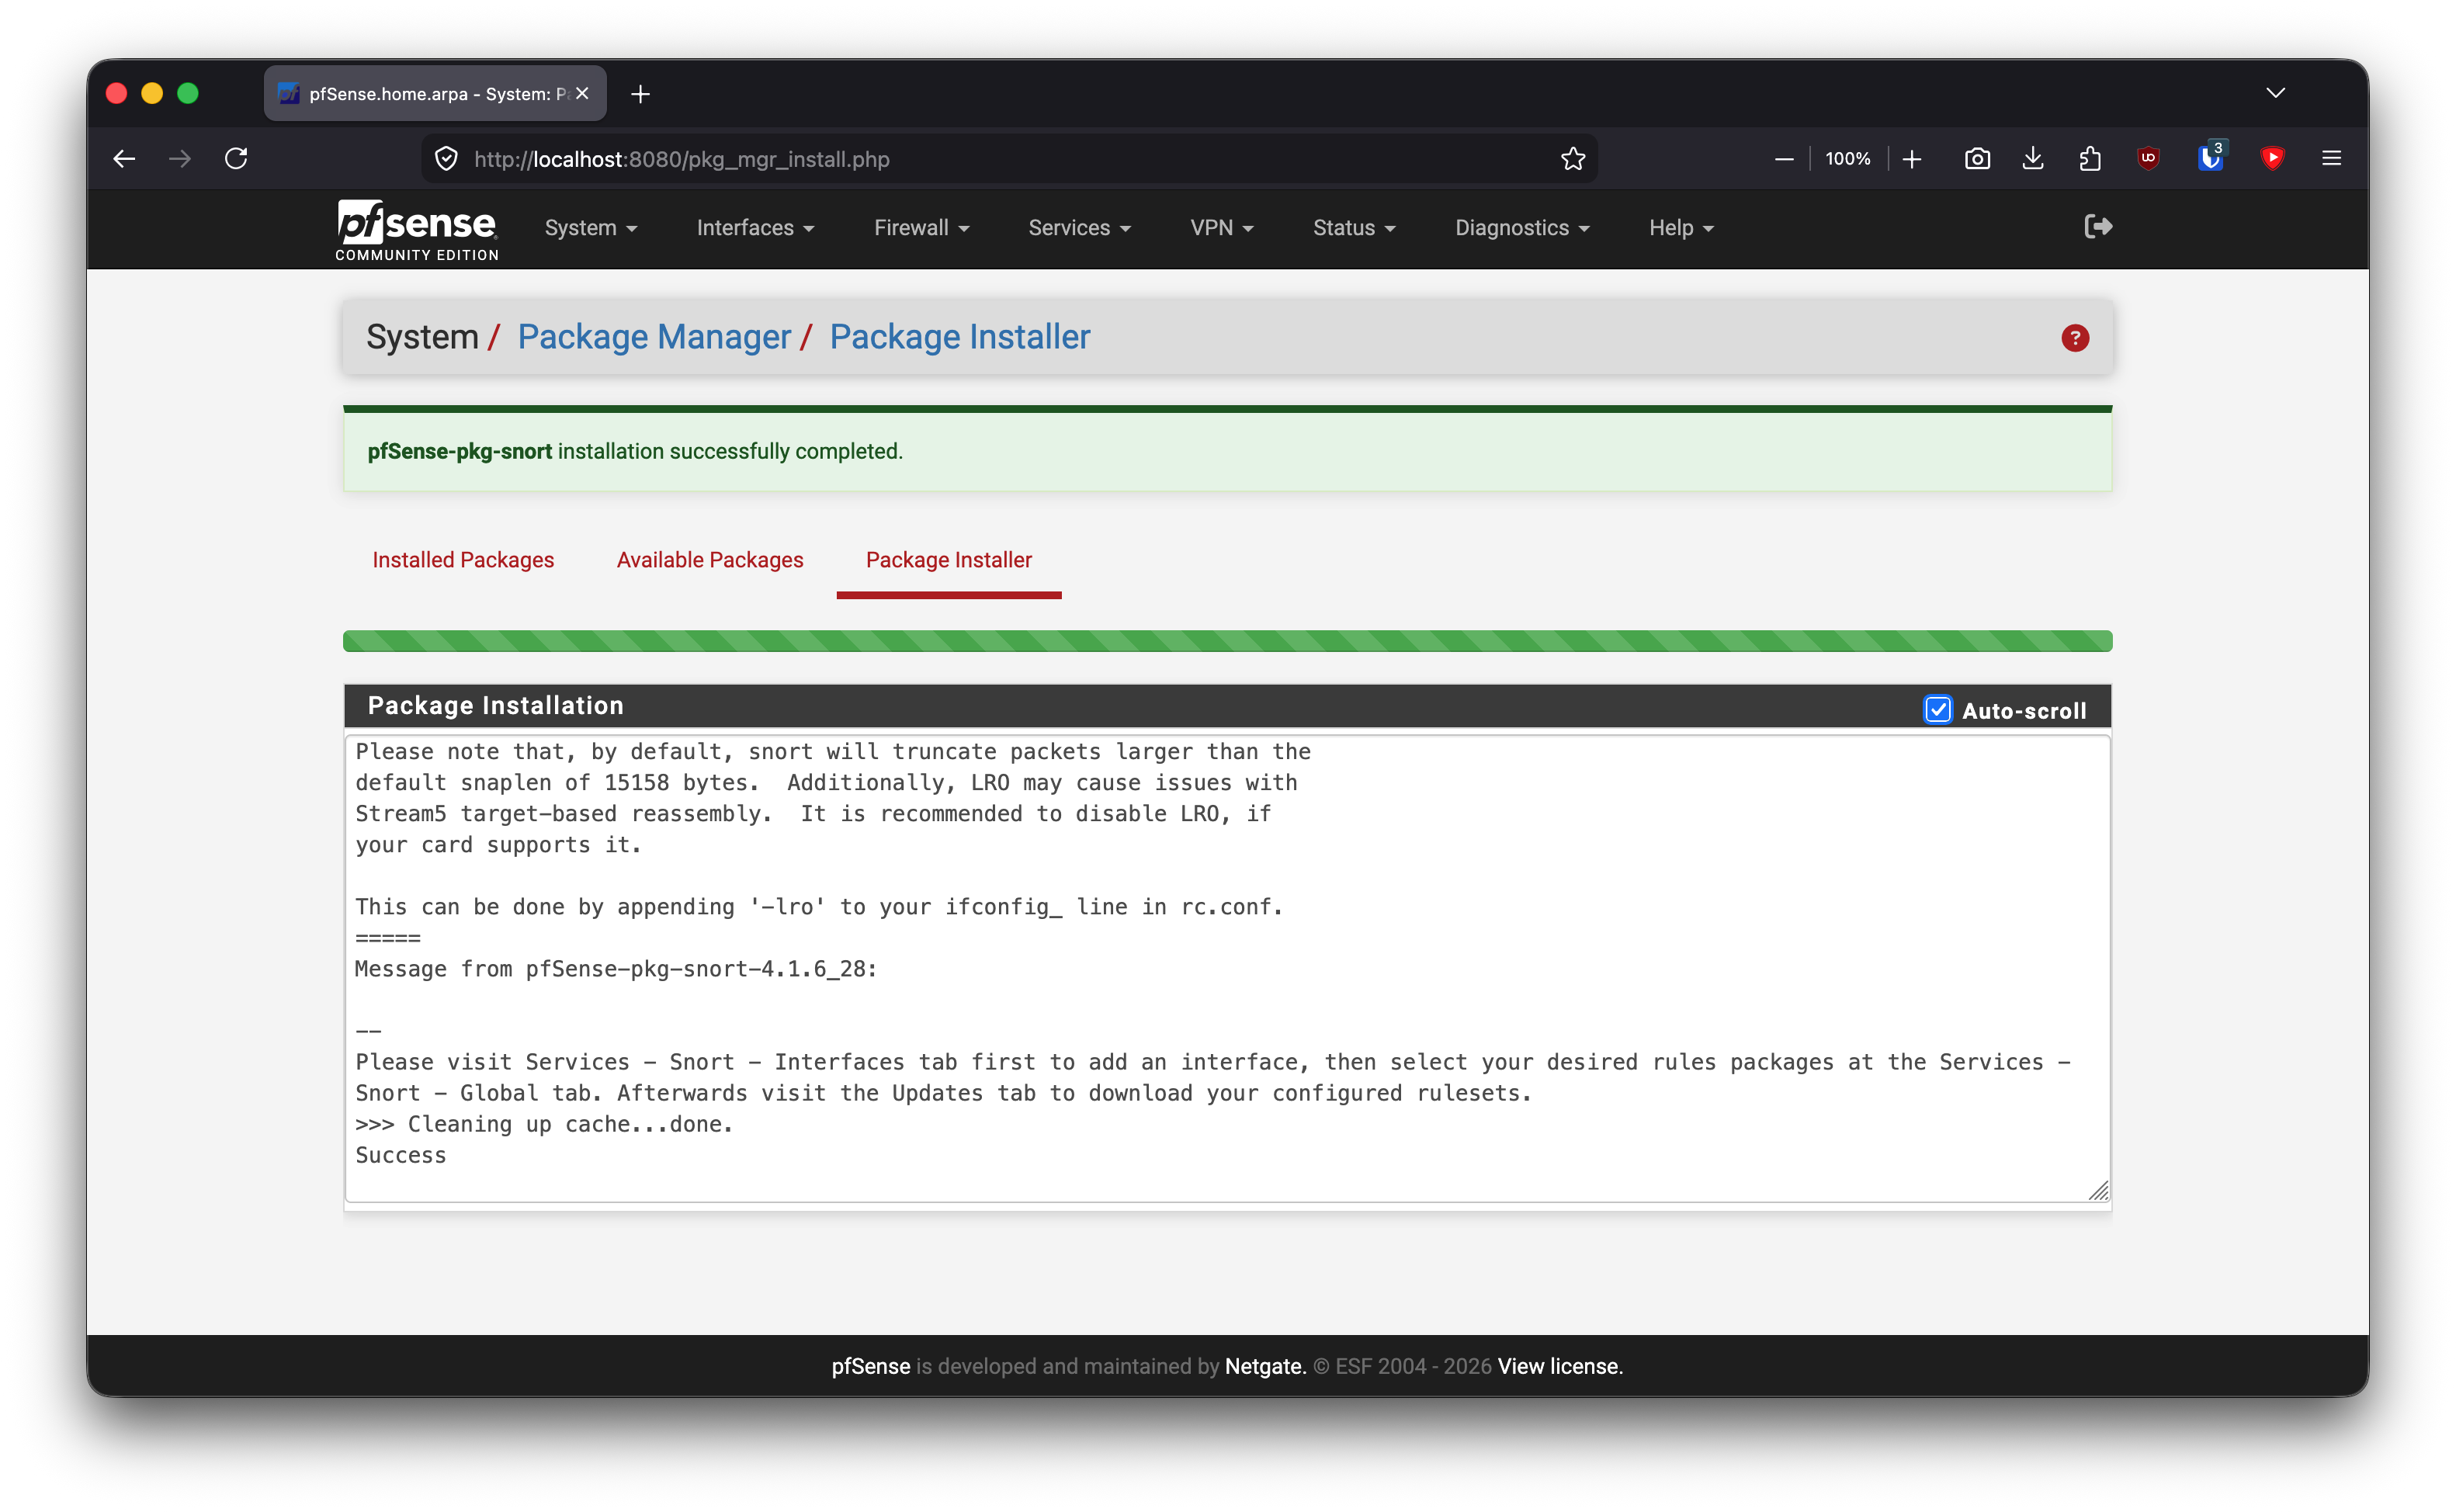
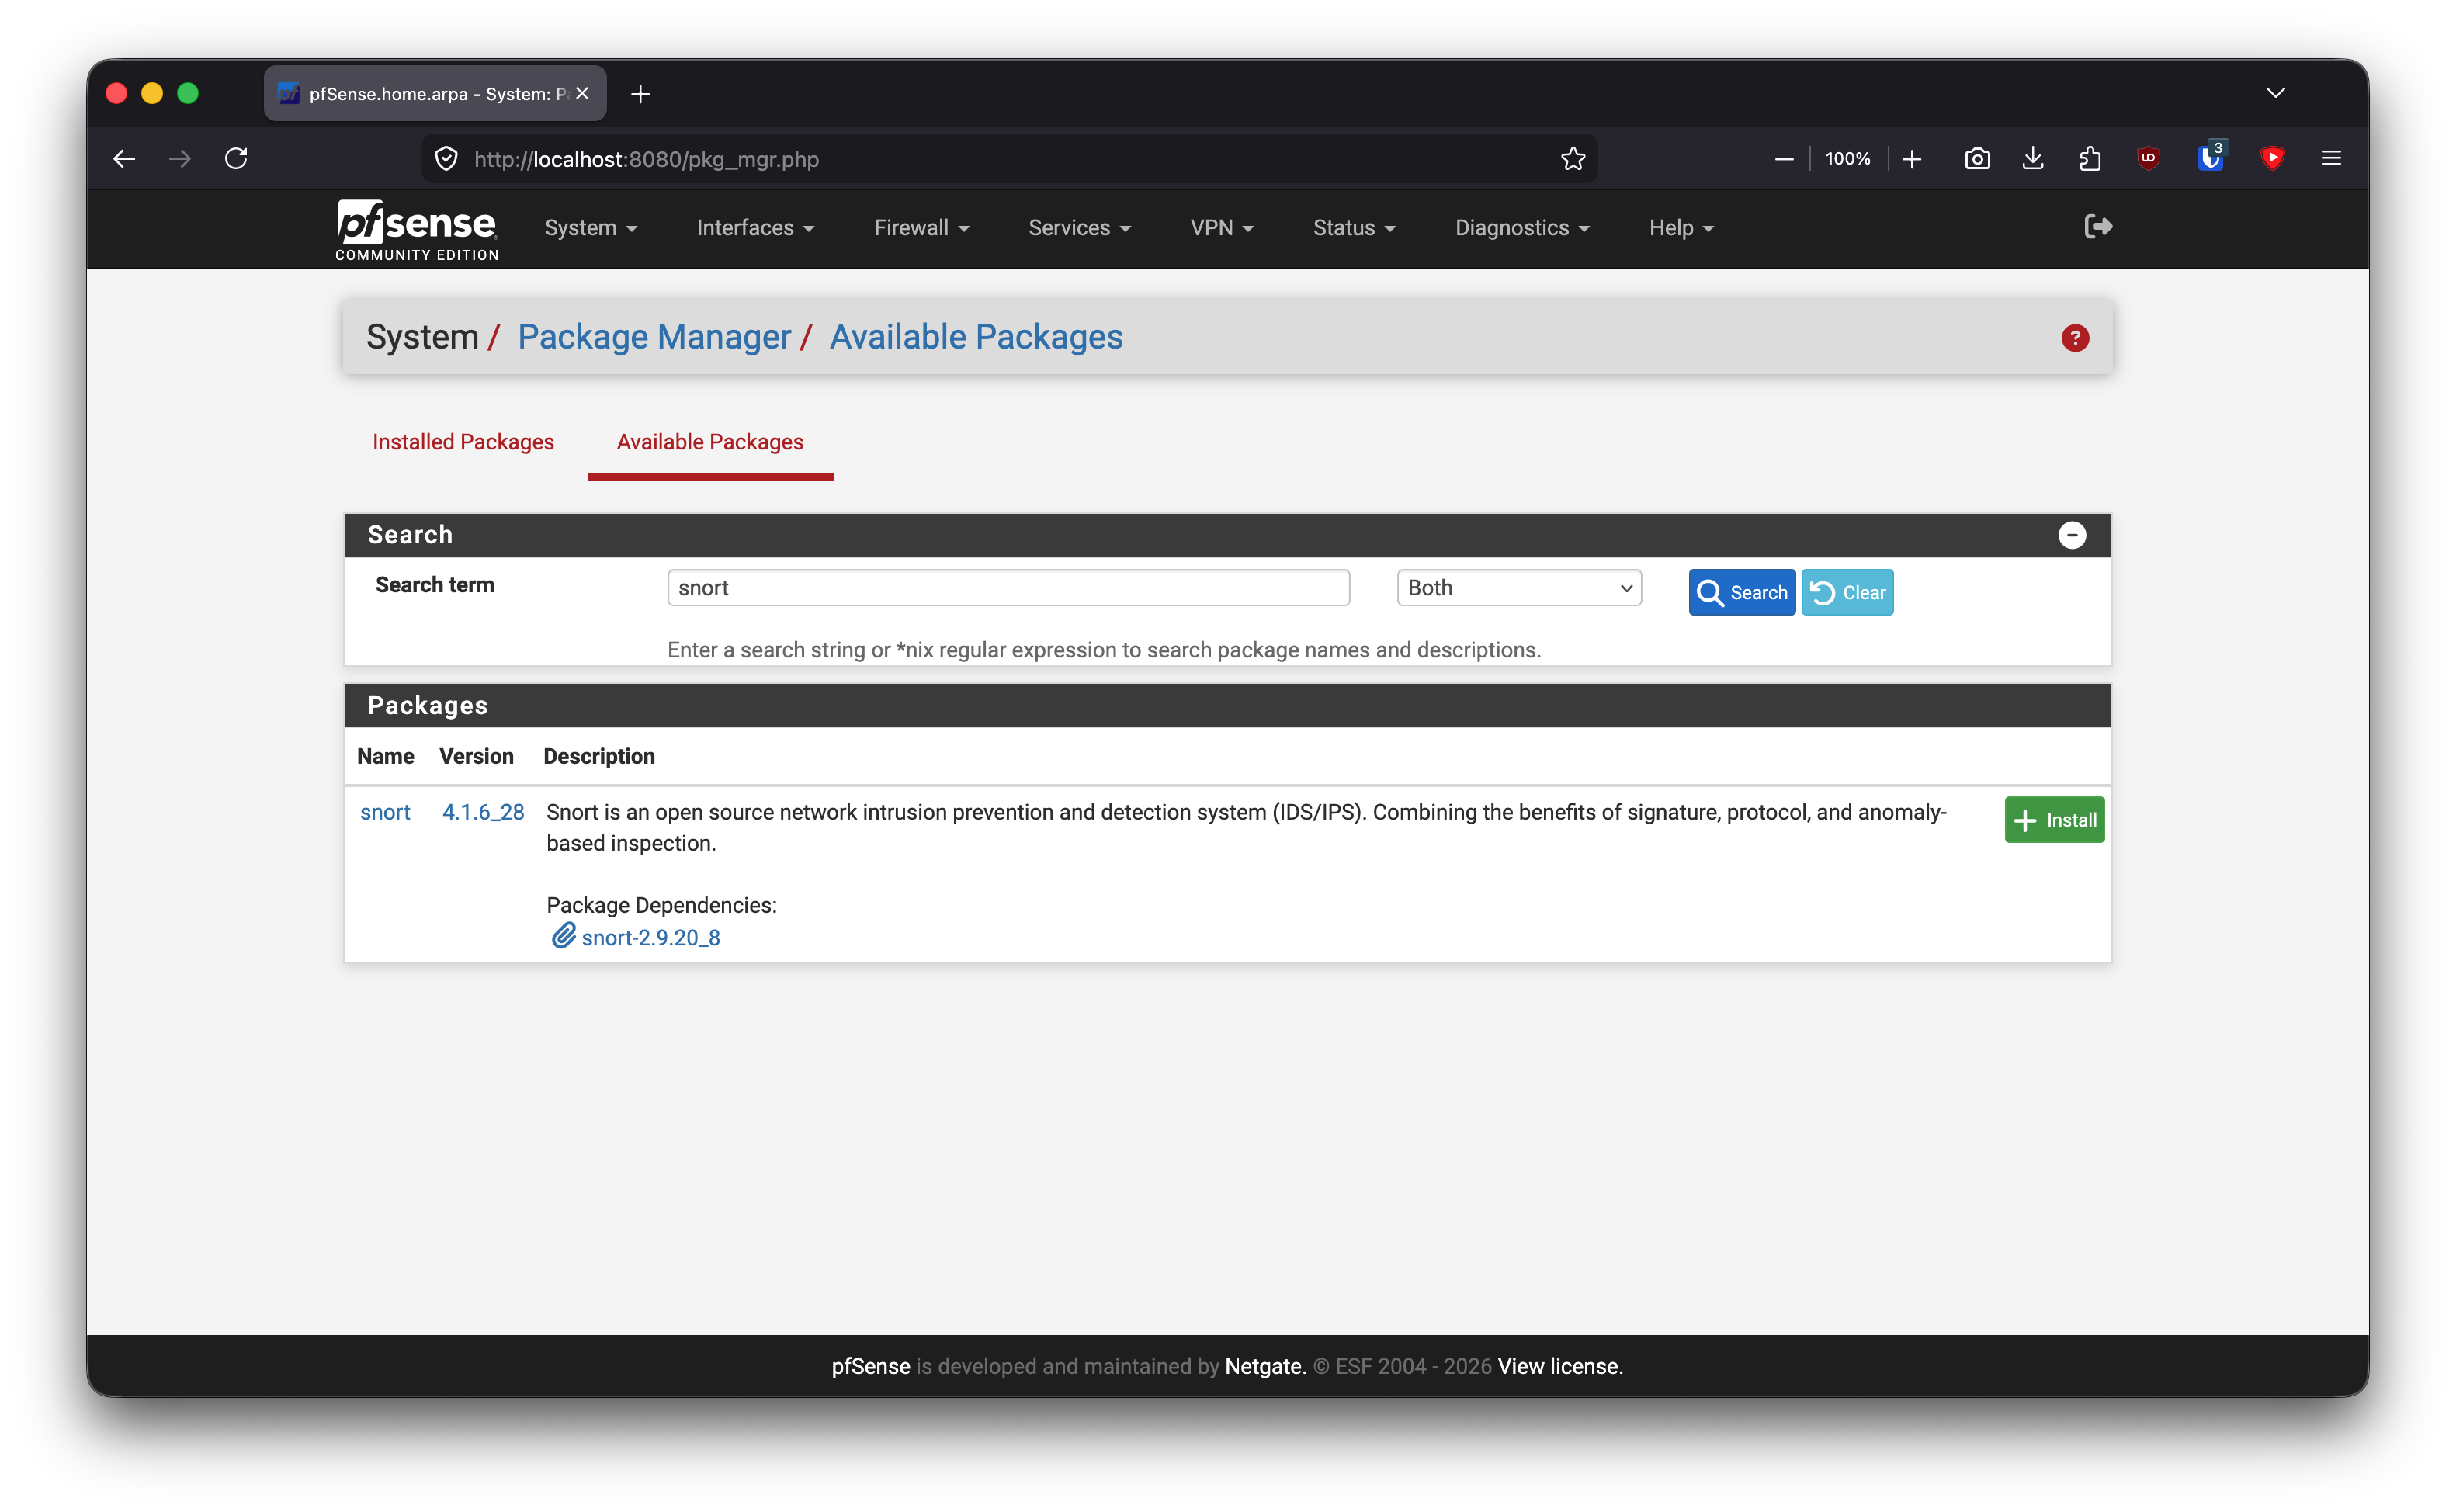
System -> Package Manager -> Available Packages -> snort -> Install
Services -> Snort
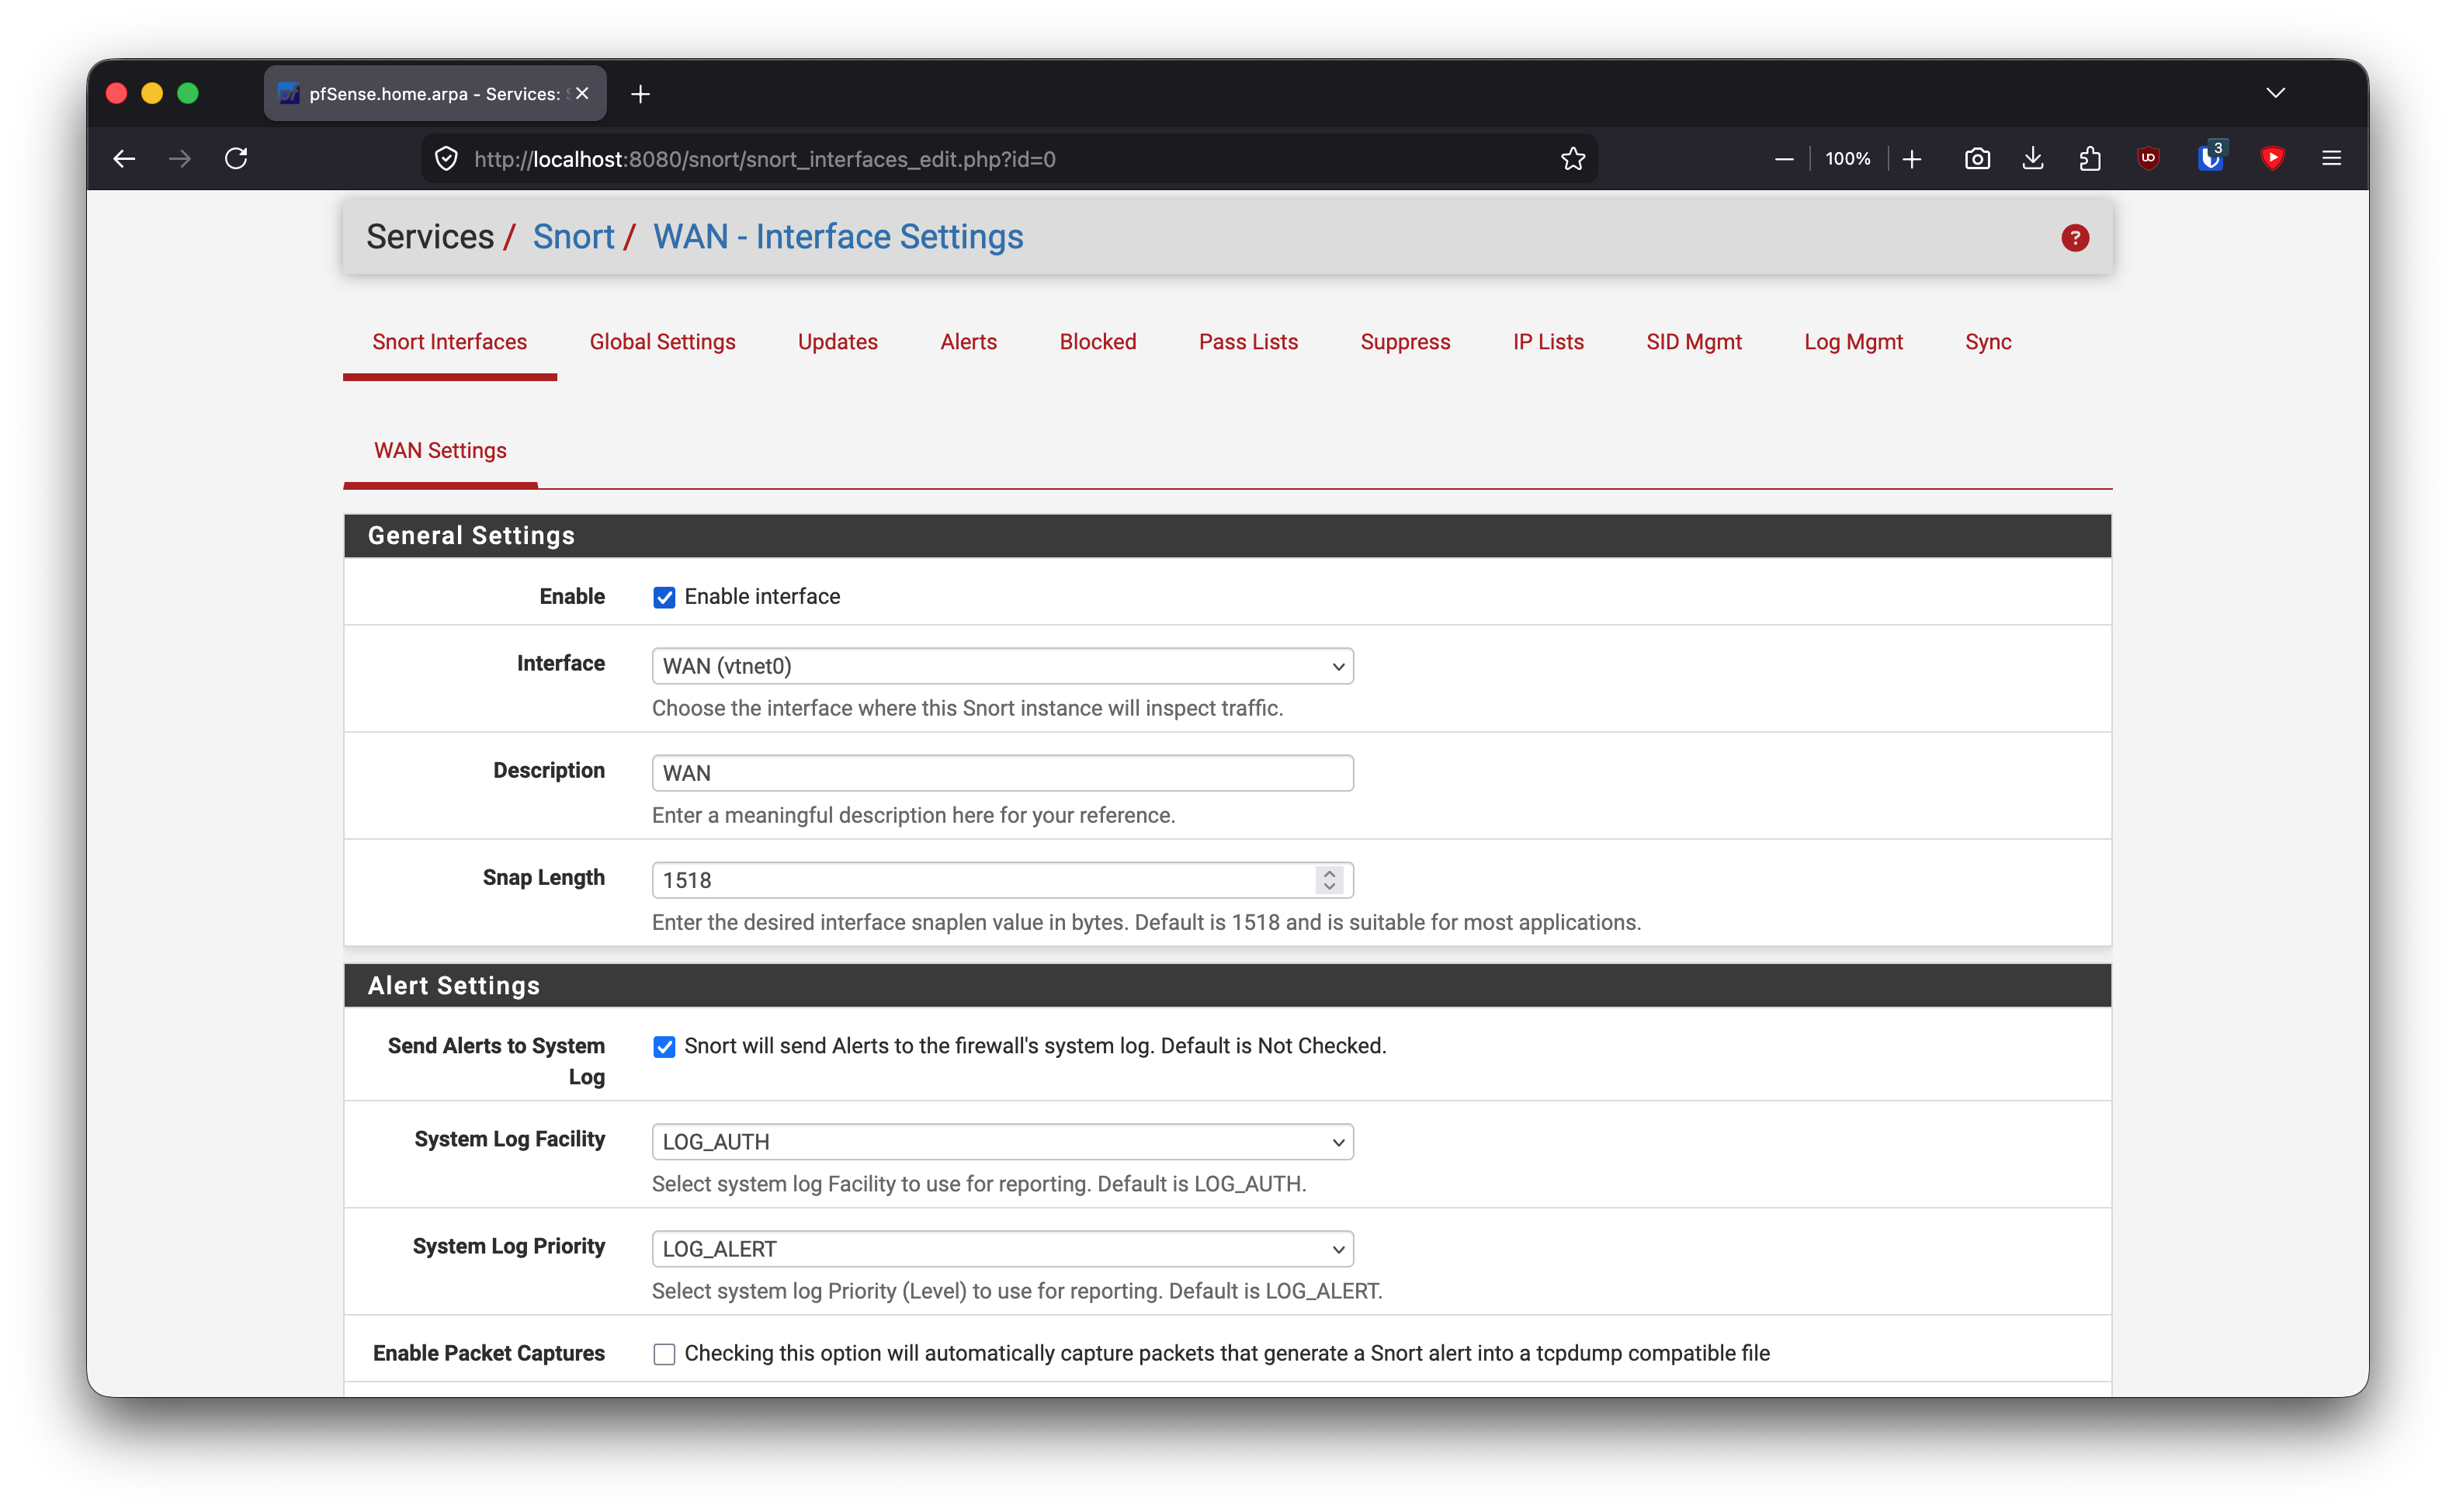
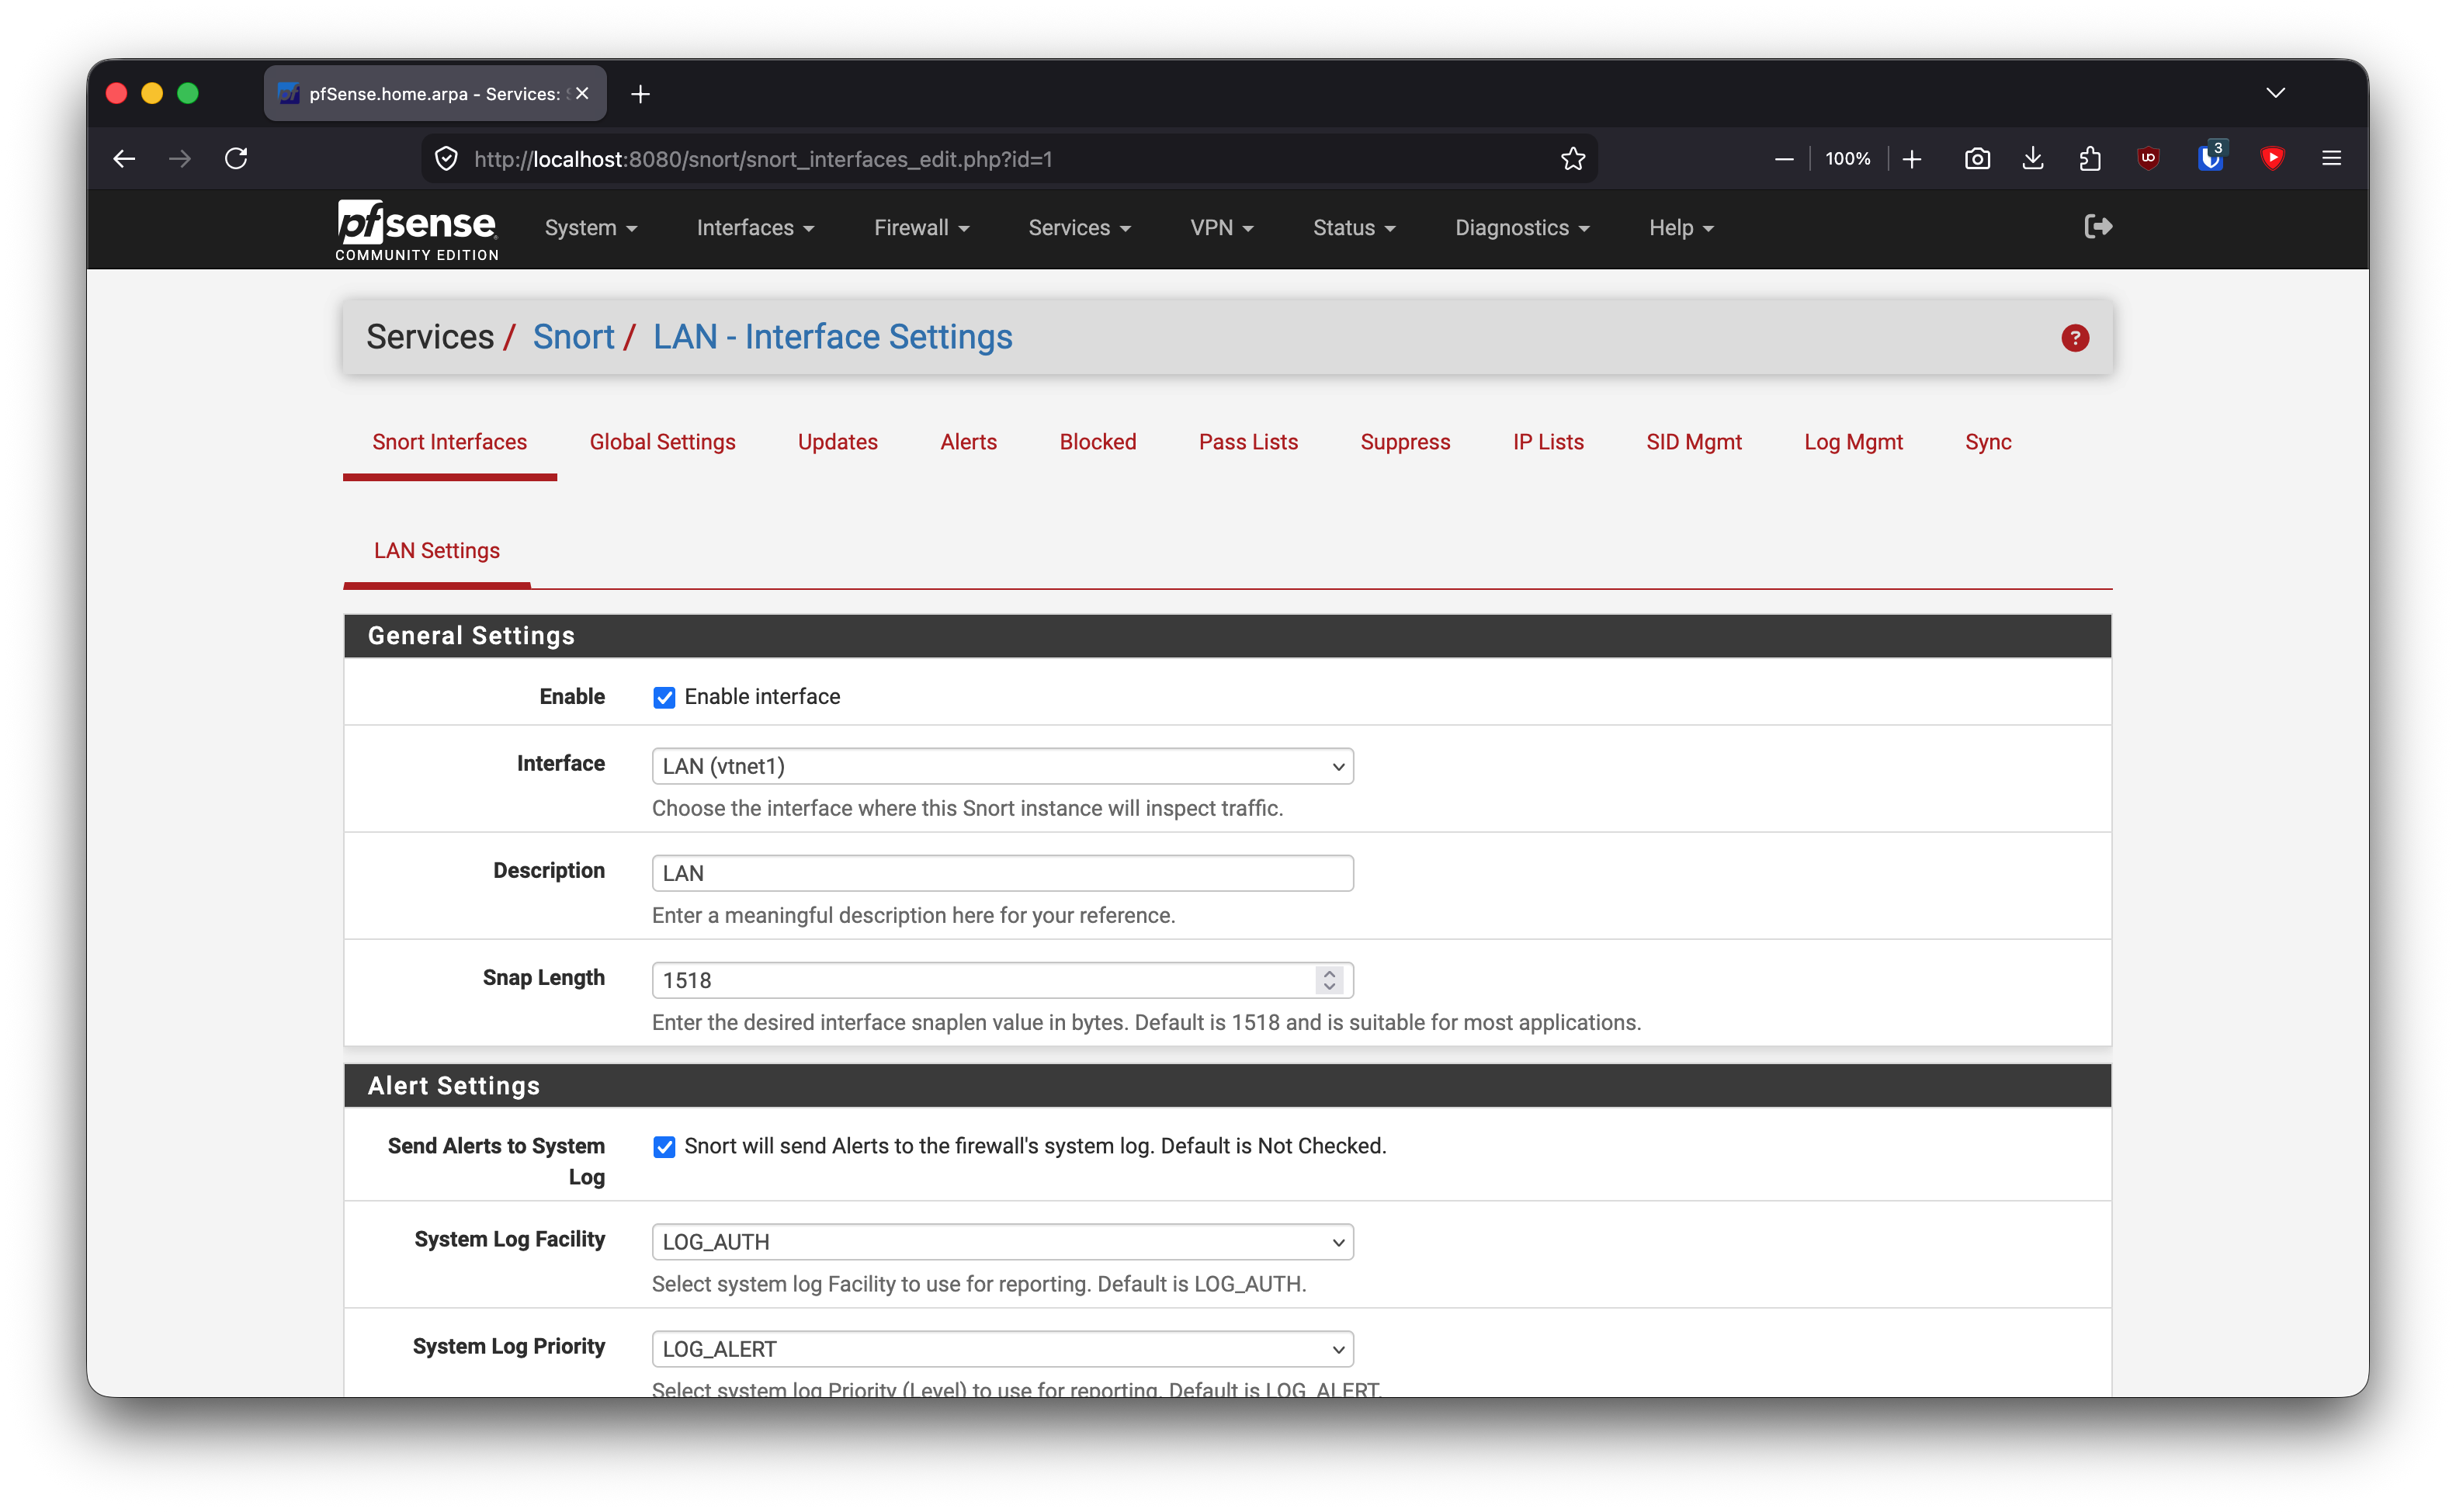
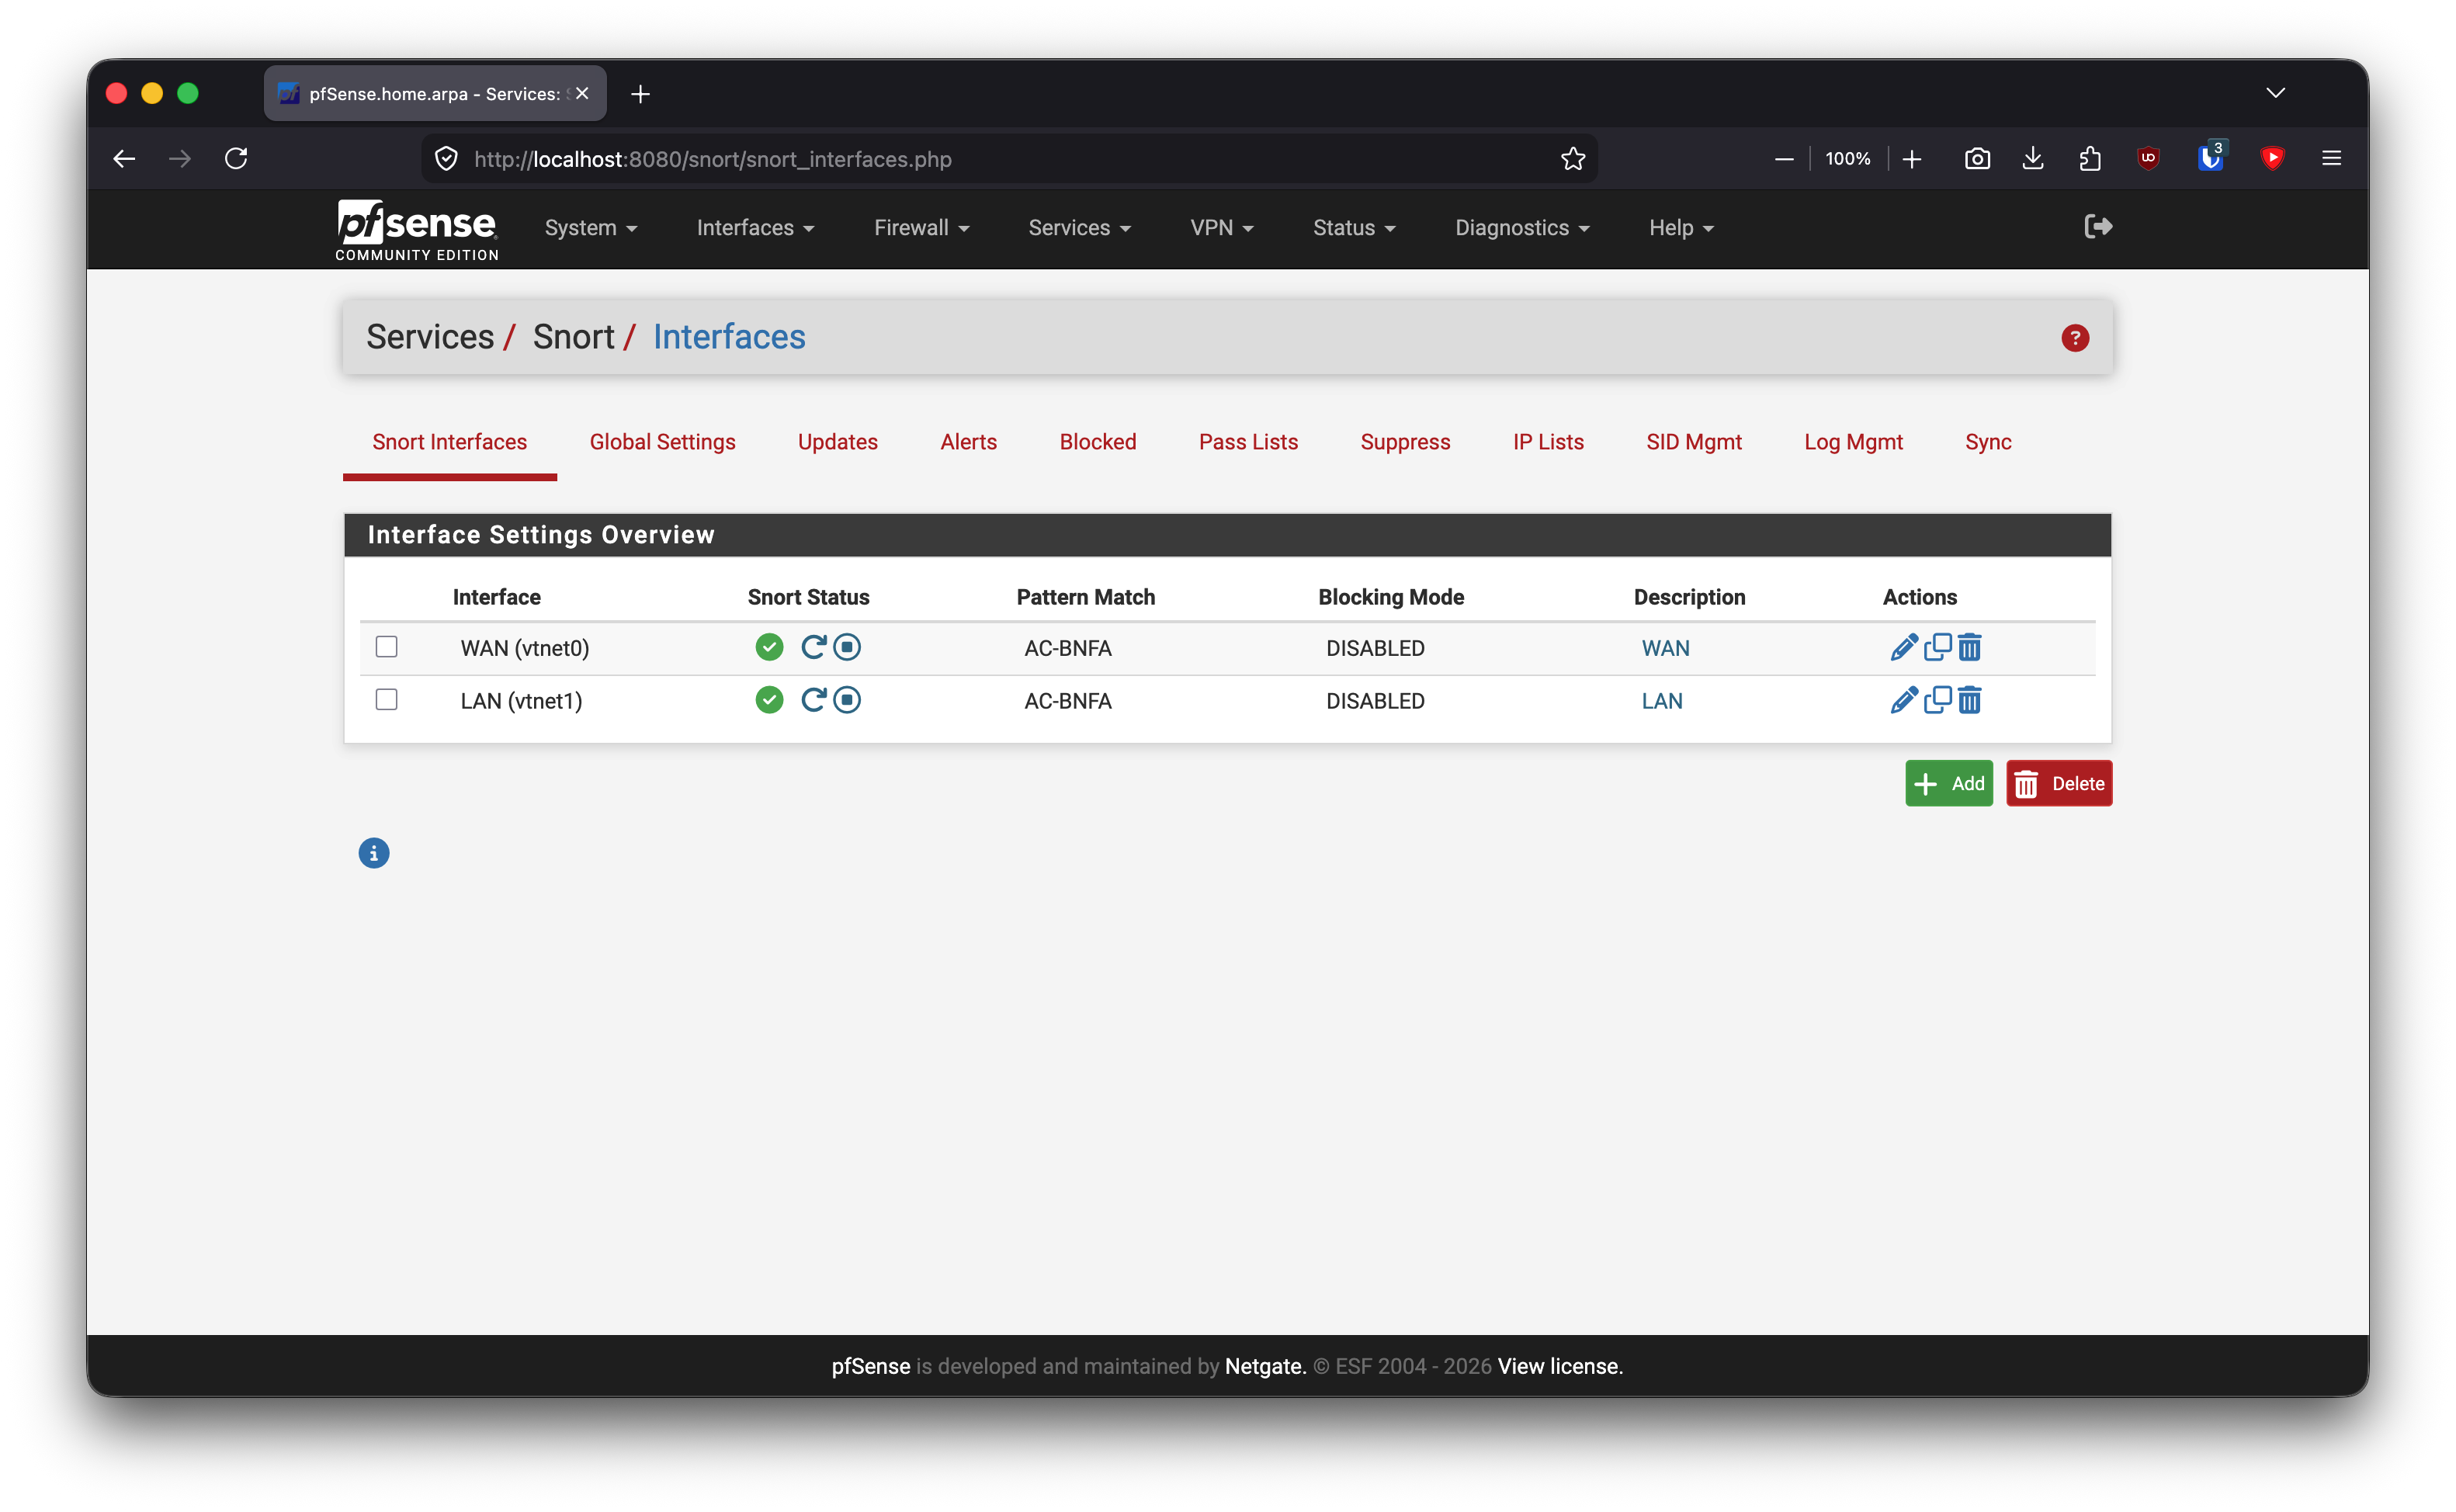
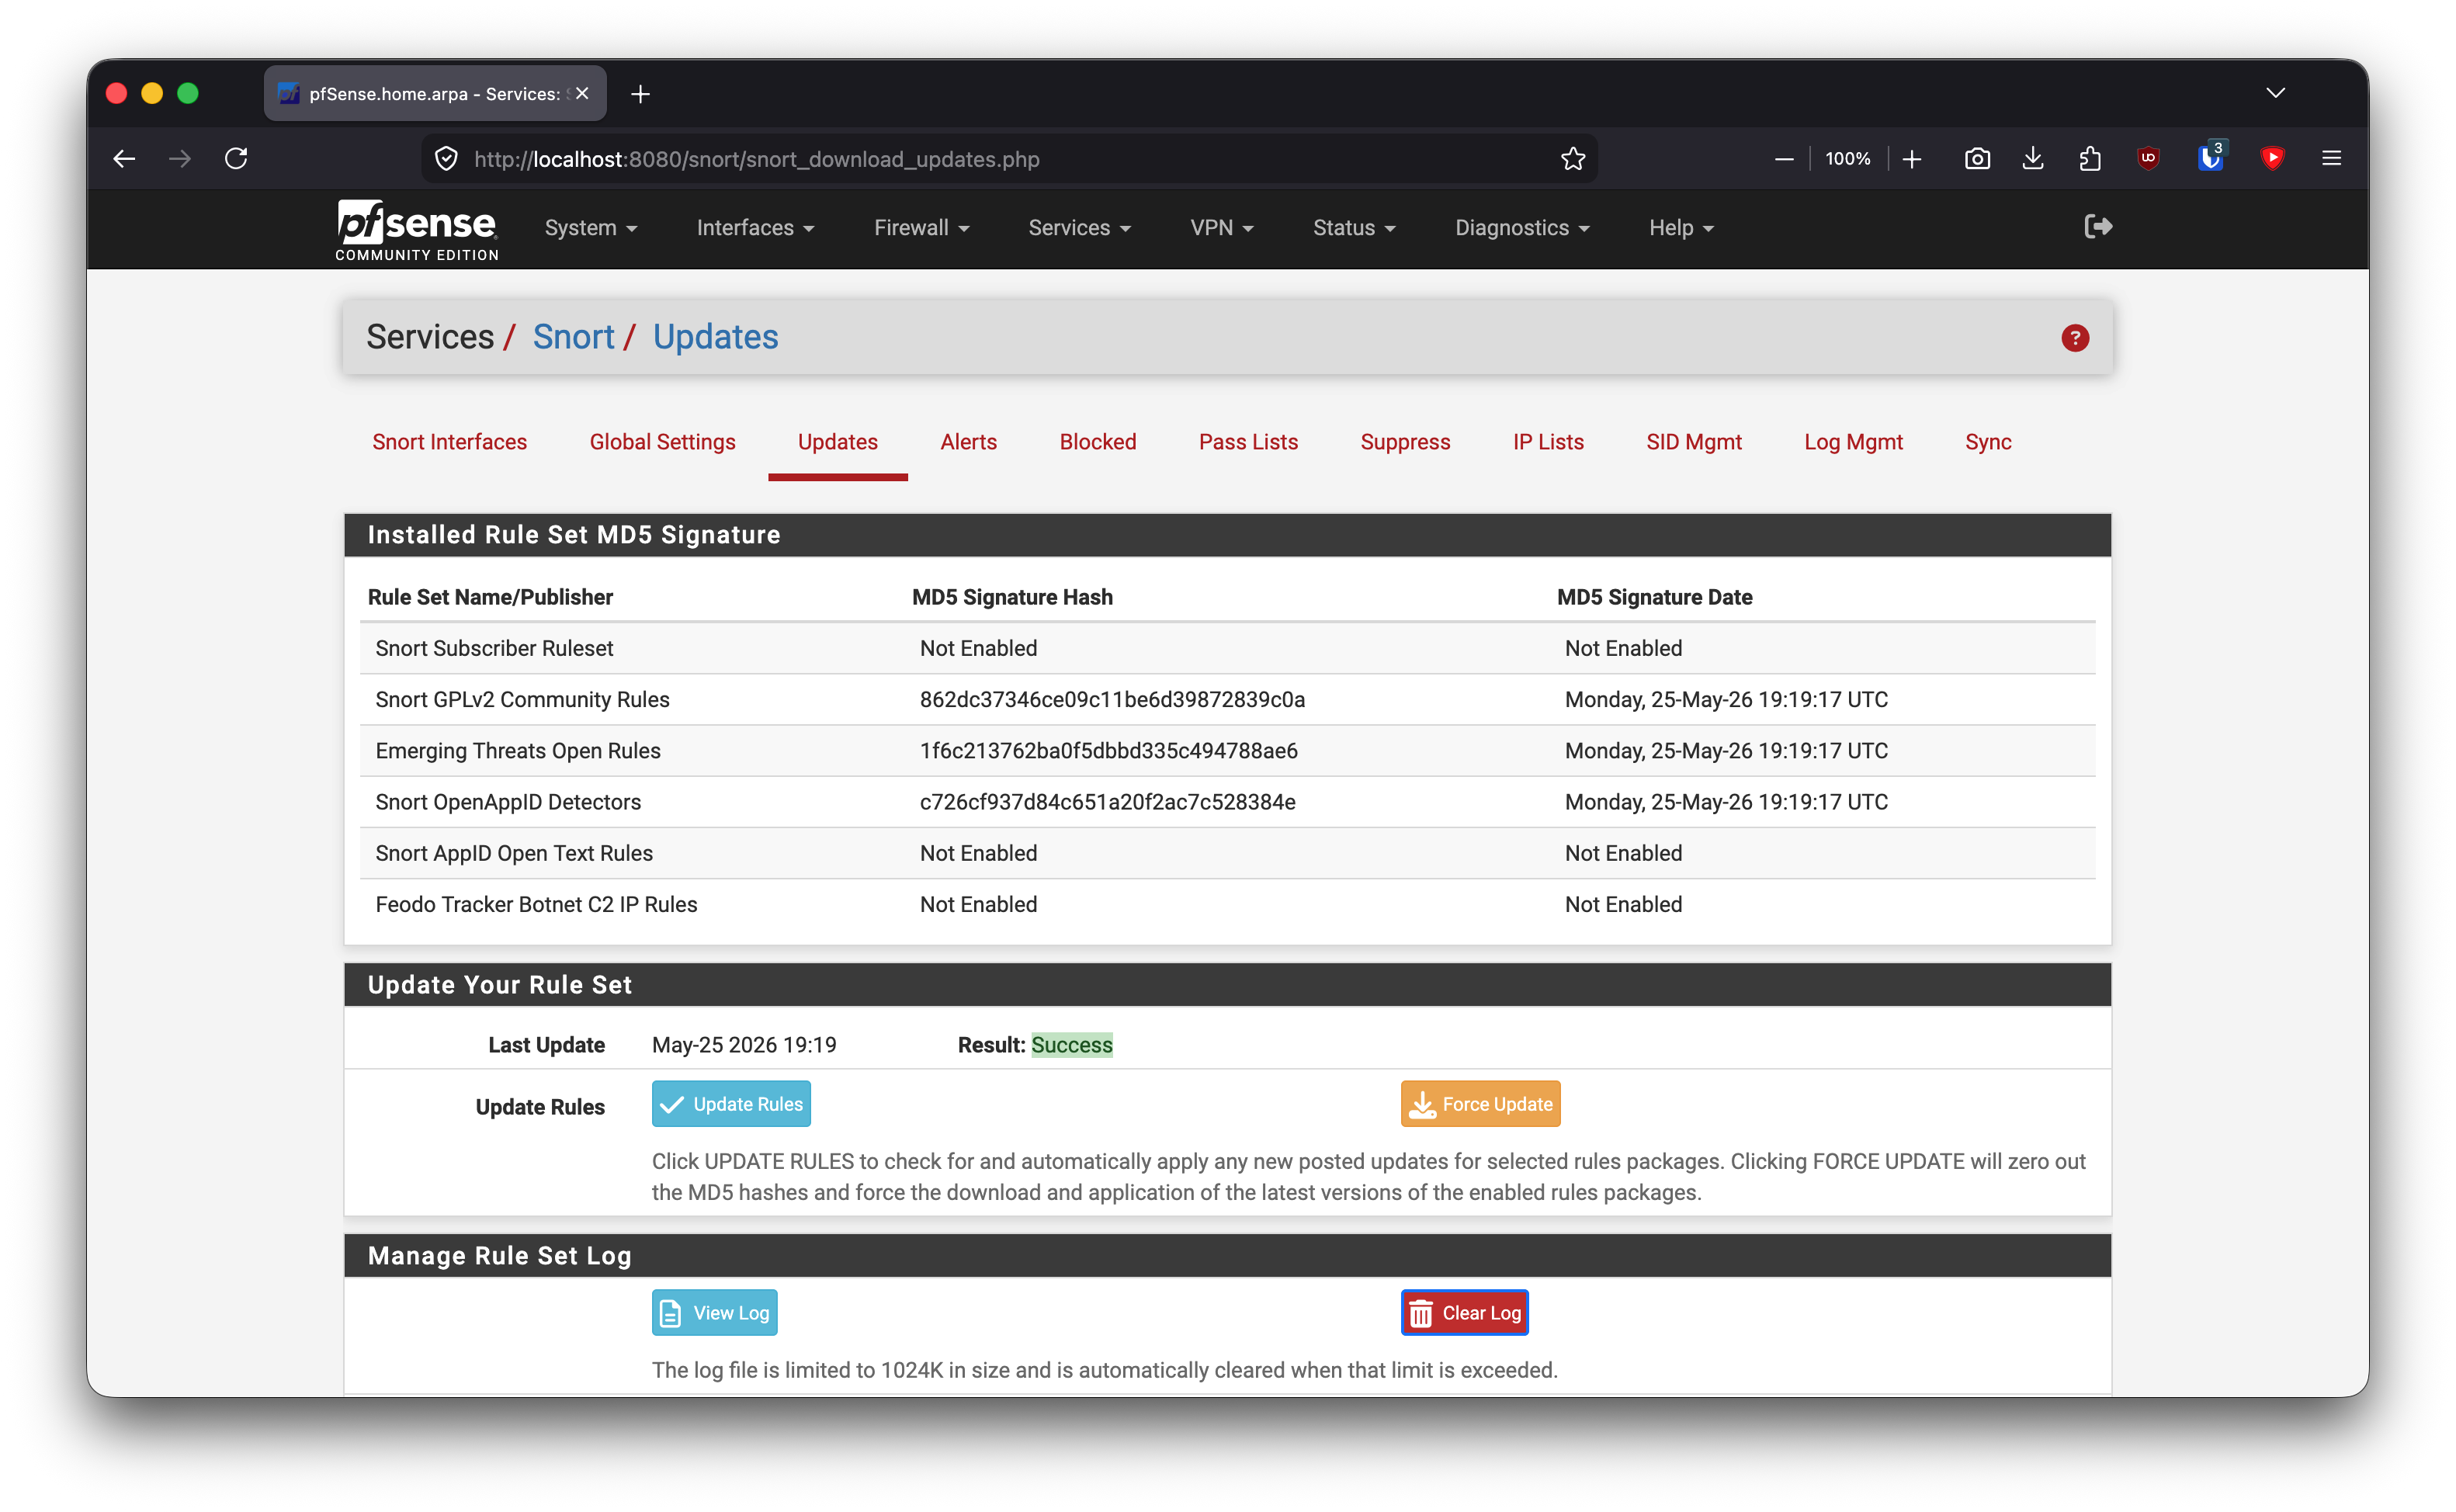
I enabled Snort on WAN and LAN with blocking disabled. This is IDS mode, not IPS mode.
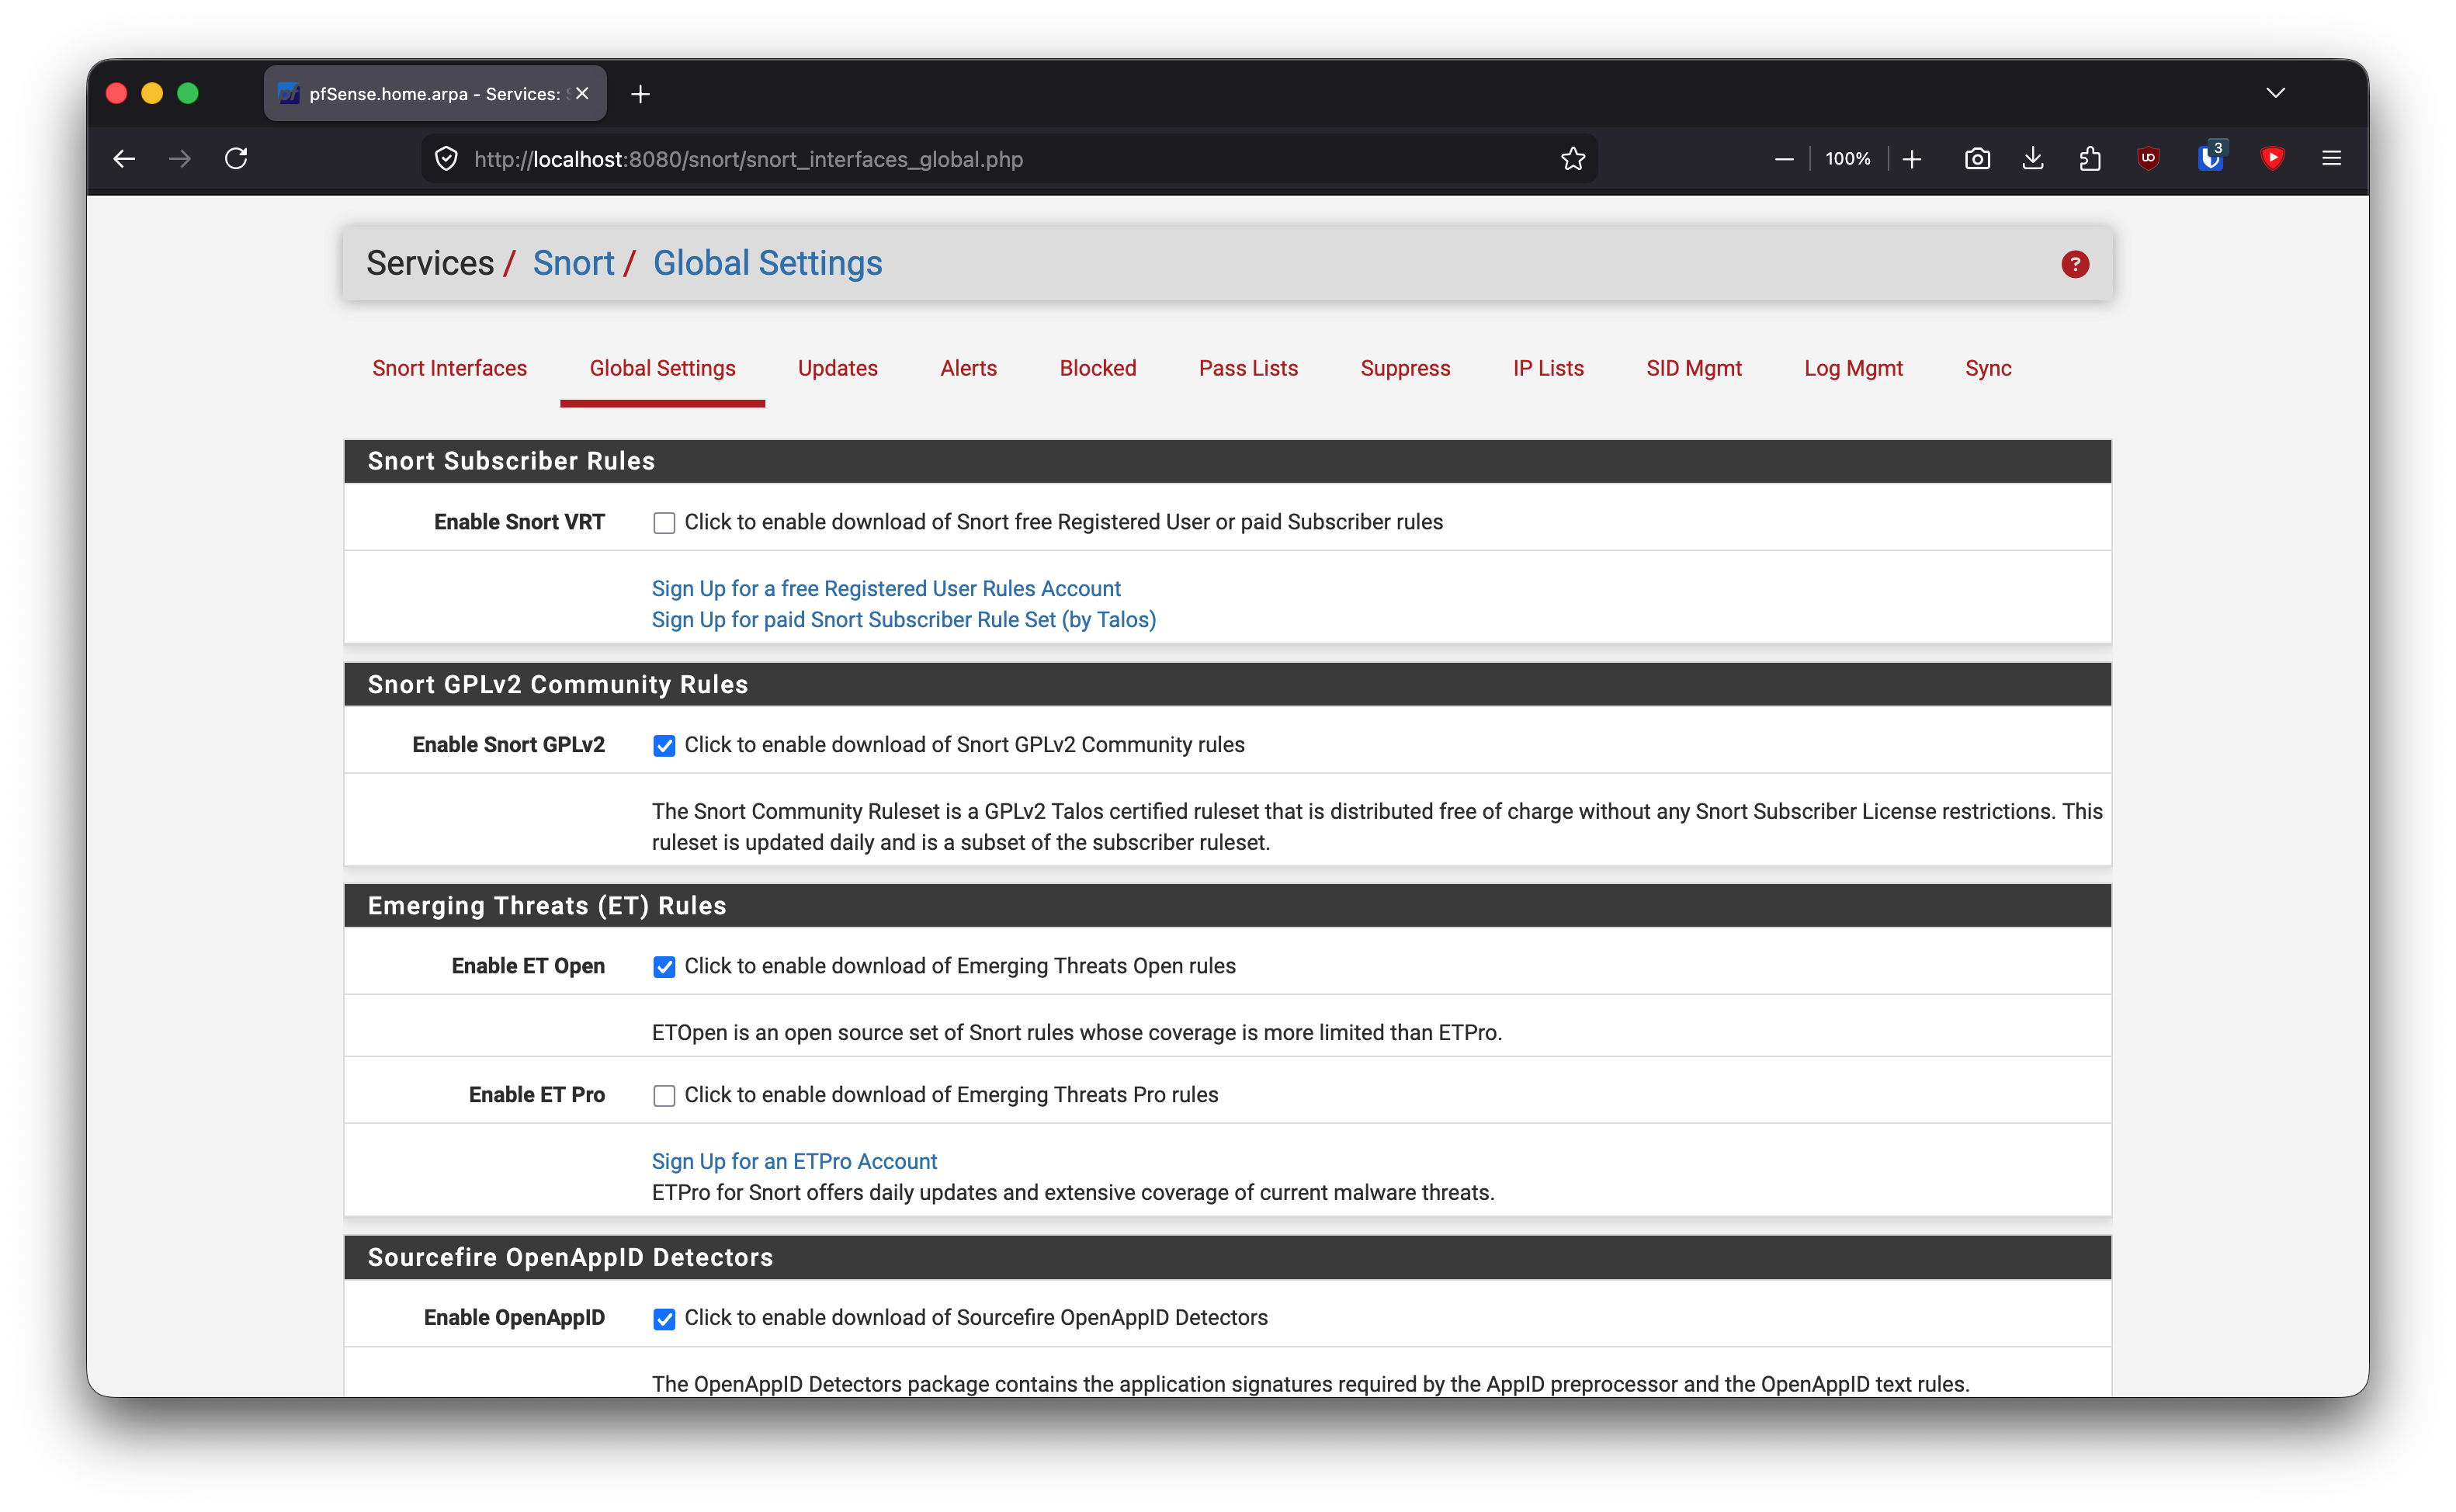
I kept the ruleset small because pfSense only had 2 GB RAM:
snort-community.rules
emerging-scan.rules
emerging-exploit.rules
emerging-malware.rules
Decode Snort CSV Alerts in Wazuh
pfSense Snort emitted CSV-style alerts that did not match Wazuh’s built-in snort-full or snort-fast decoders. I added a local decoder.
/var/ossec/etc/decoders/local_decoder.xml:
<decoder name="snort-csv">
  <prematch>^\d\d/\d\d/\d\d-\d\d:\d\d:\d\d.\d+ ,</prematch>
</decoder>
<decoder name="snort-csv-fields">
  <parent>snort-csv</parent>
  <regex>"([^"]+)",(\w+),([\d.]+),(\d*),([\d.]+),(\d*),\d+,([^,]+),(\d+)</regex>
  <order>id,protocol,srcip,srcport,dstip,dstport,extra_data,severity</order>
</decoder>
/var/ossec/etc/rules/local_rules.xml:
<group name="snort,">
  <rule id="100100" level="5">
    <decoded_as>snort-csv</decoded_as>
    <description>Snort alert</description>
  </rule>
</group>
Validate the decoder:
sudo /var/ossec/bin/wazuh-logtest
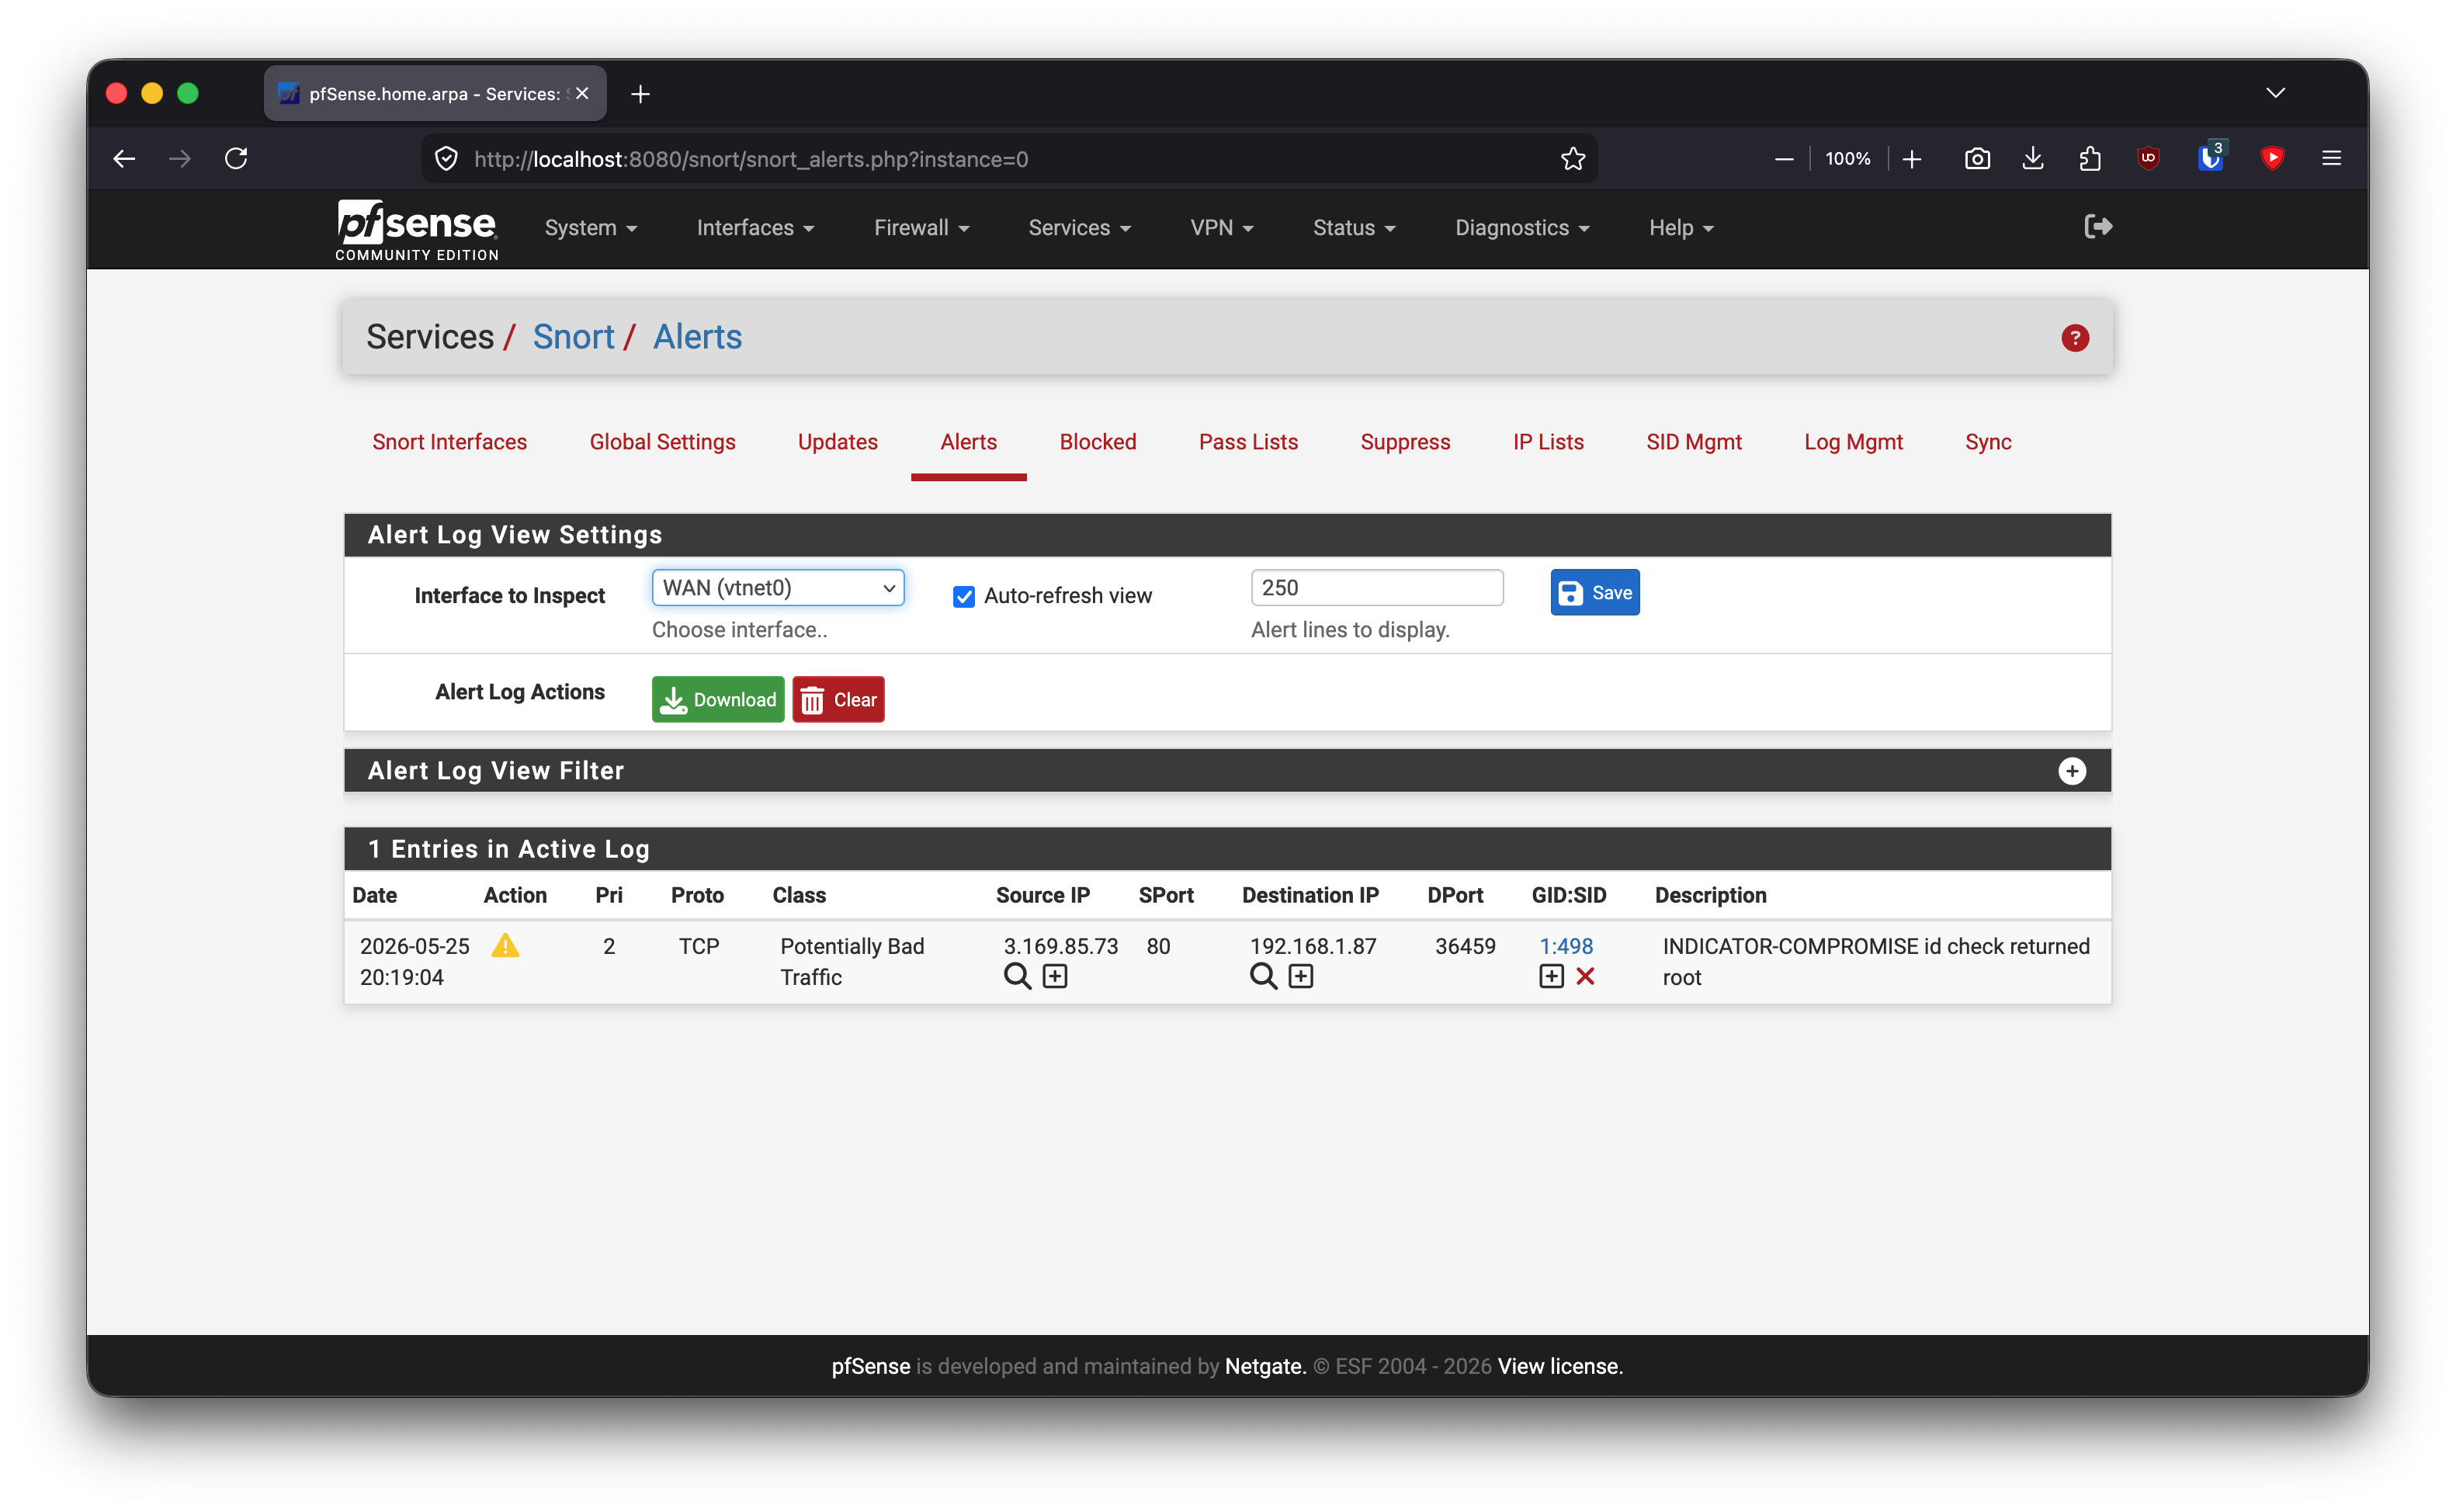
Trigger a known test alert:
curl http://testmynids.org/uid/index.html
Correct Wazuh queries:
rule.id:100100
decoder.name:snort-csv
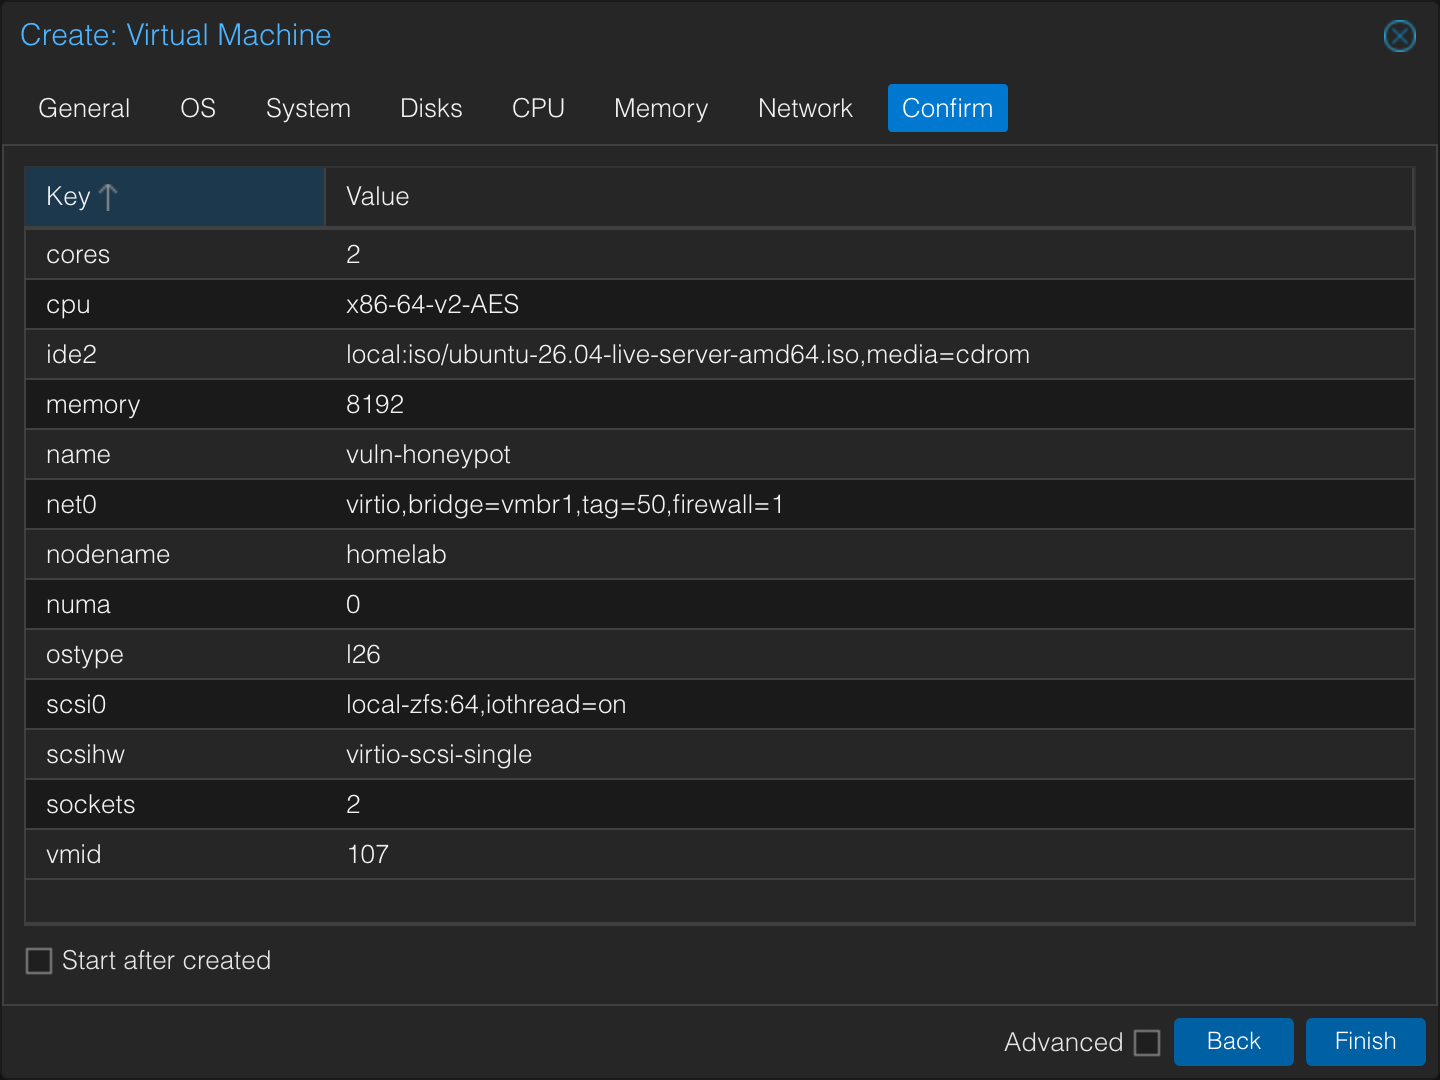
Deploy T-Pot
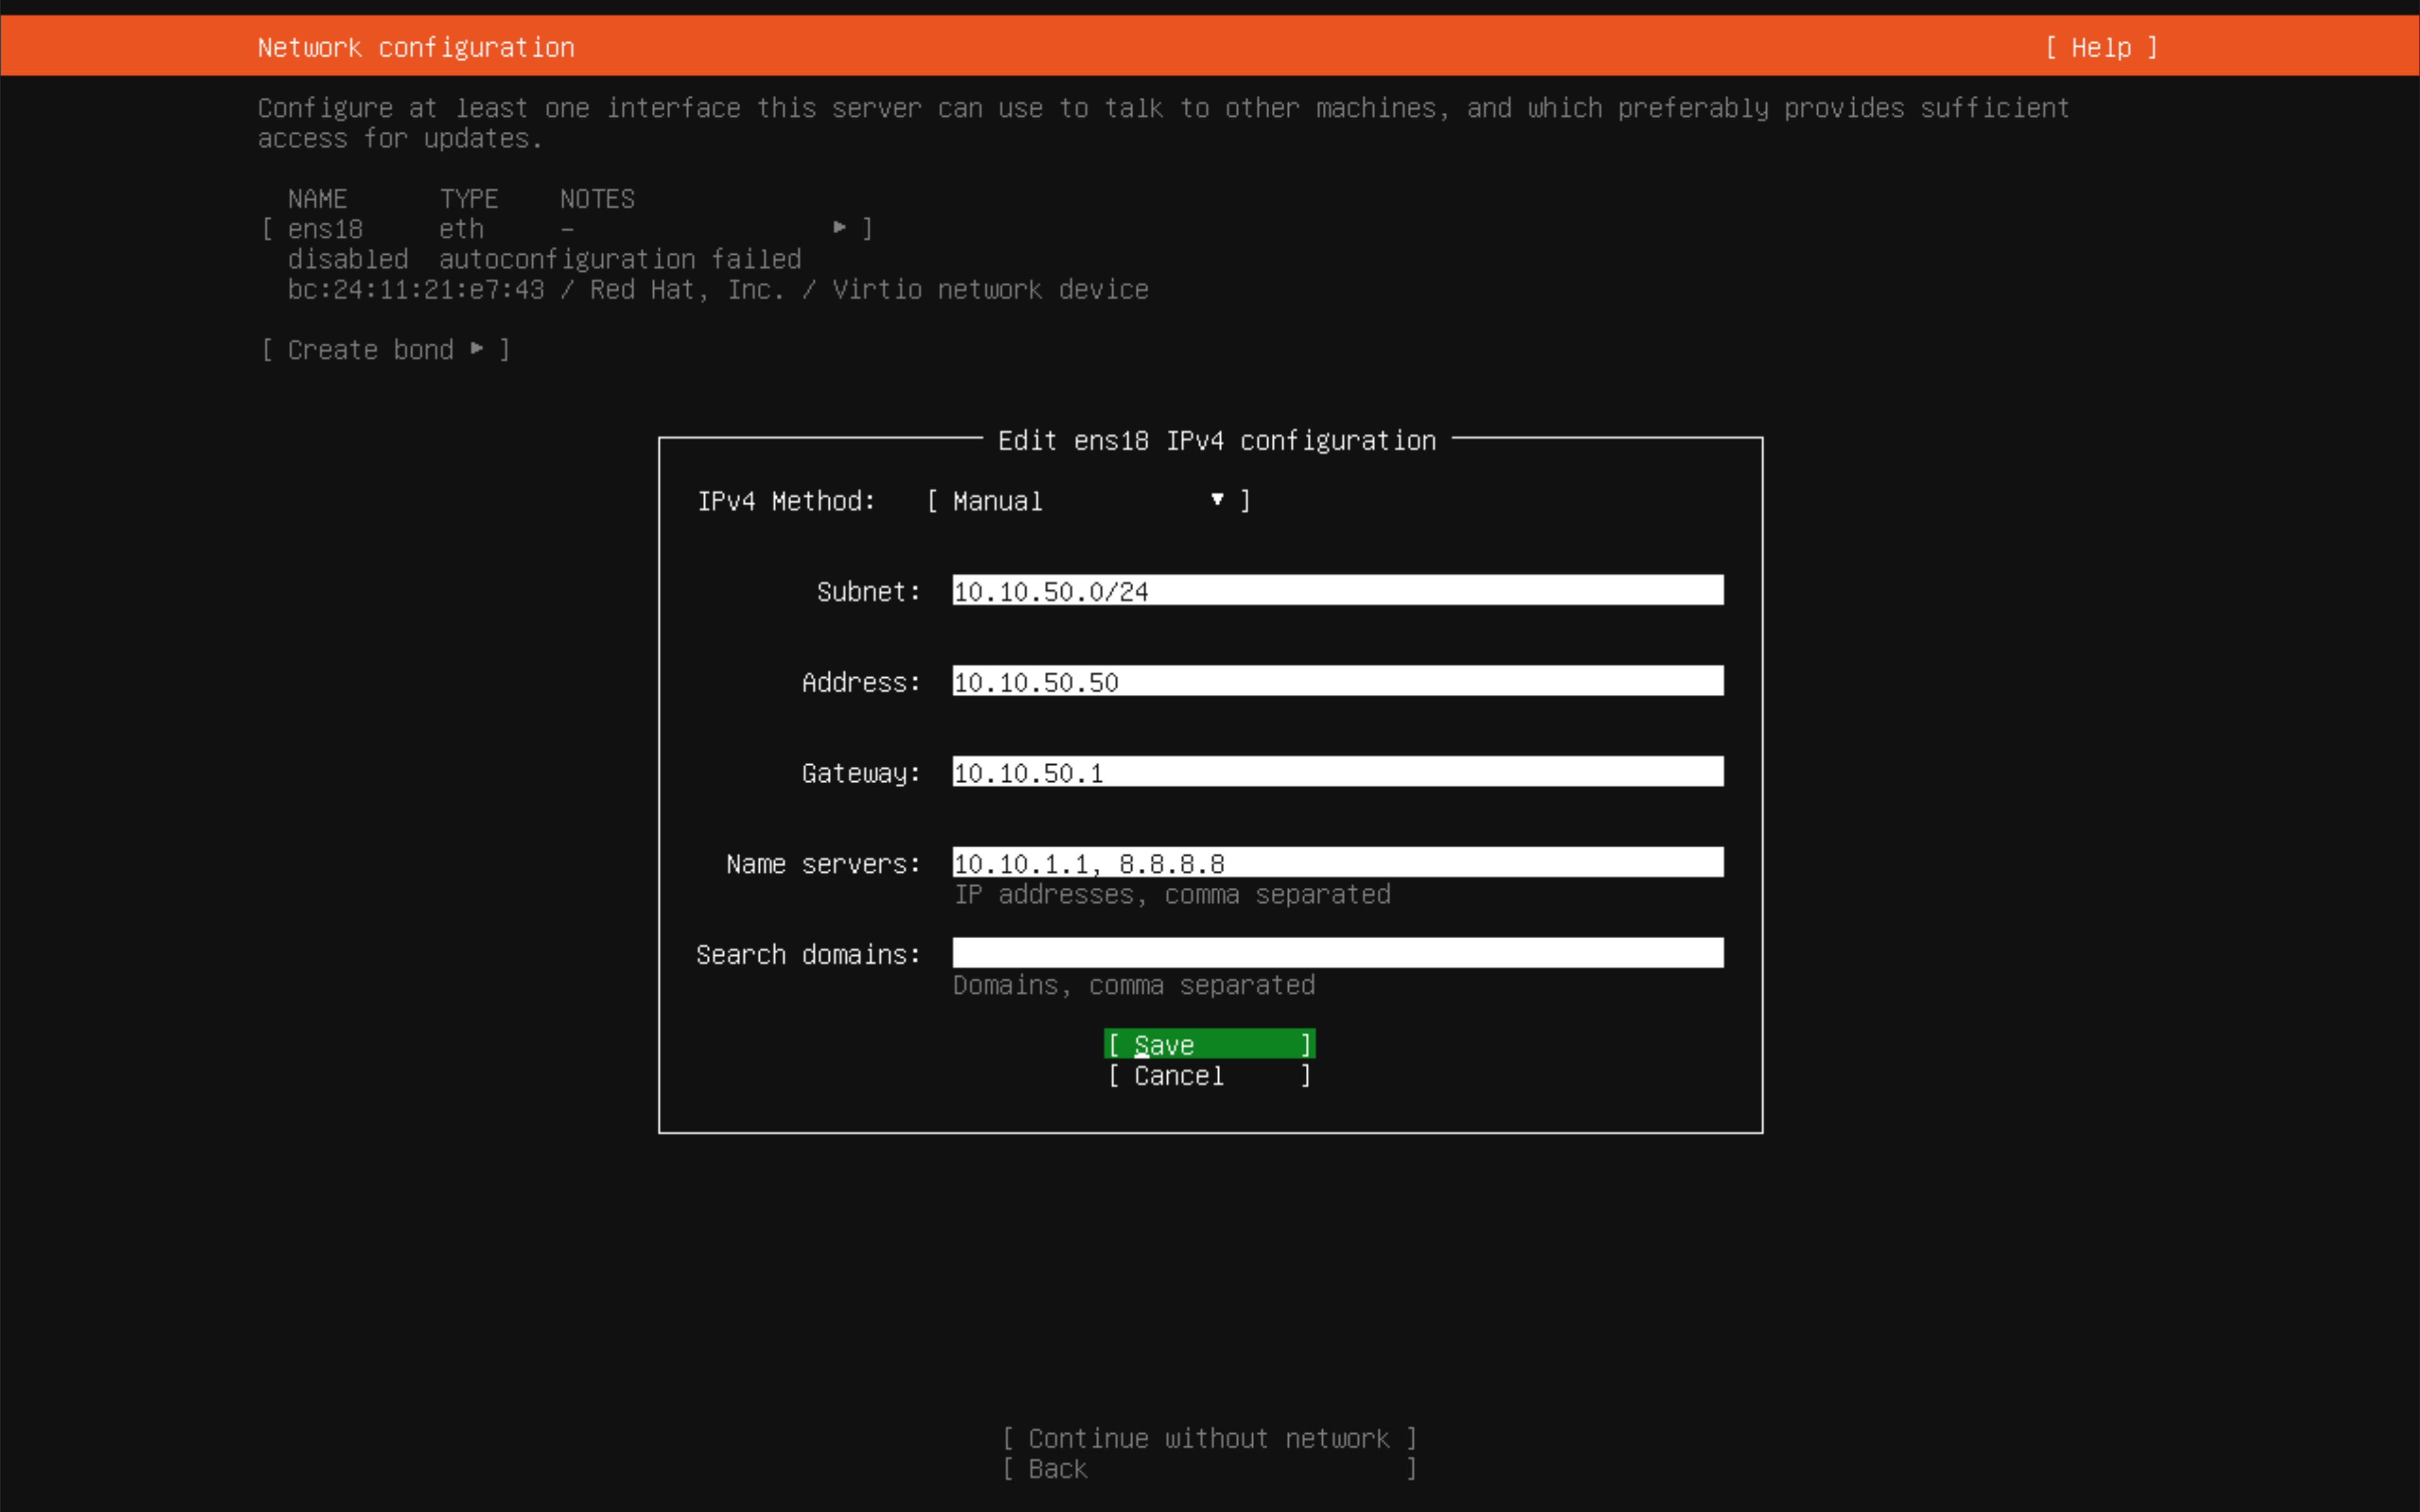
T-Pot lives in the HONEYPOT VLAN. I used the lighter install profile to keep resource usage reasonable.
env bash -c "$(curl -sL https://github.com/telekom-security/tpotce/raw/master/install.sh)"
Forward T-Pot Suricata Logs to Wazuh
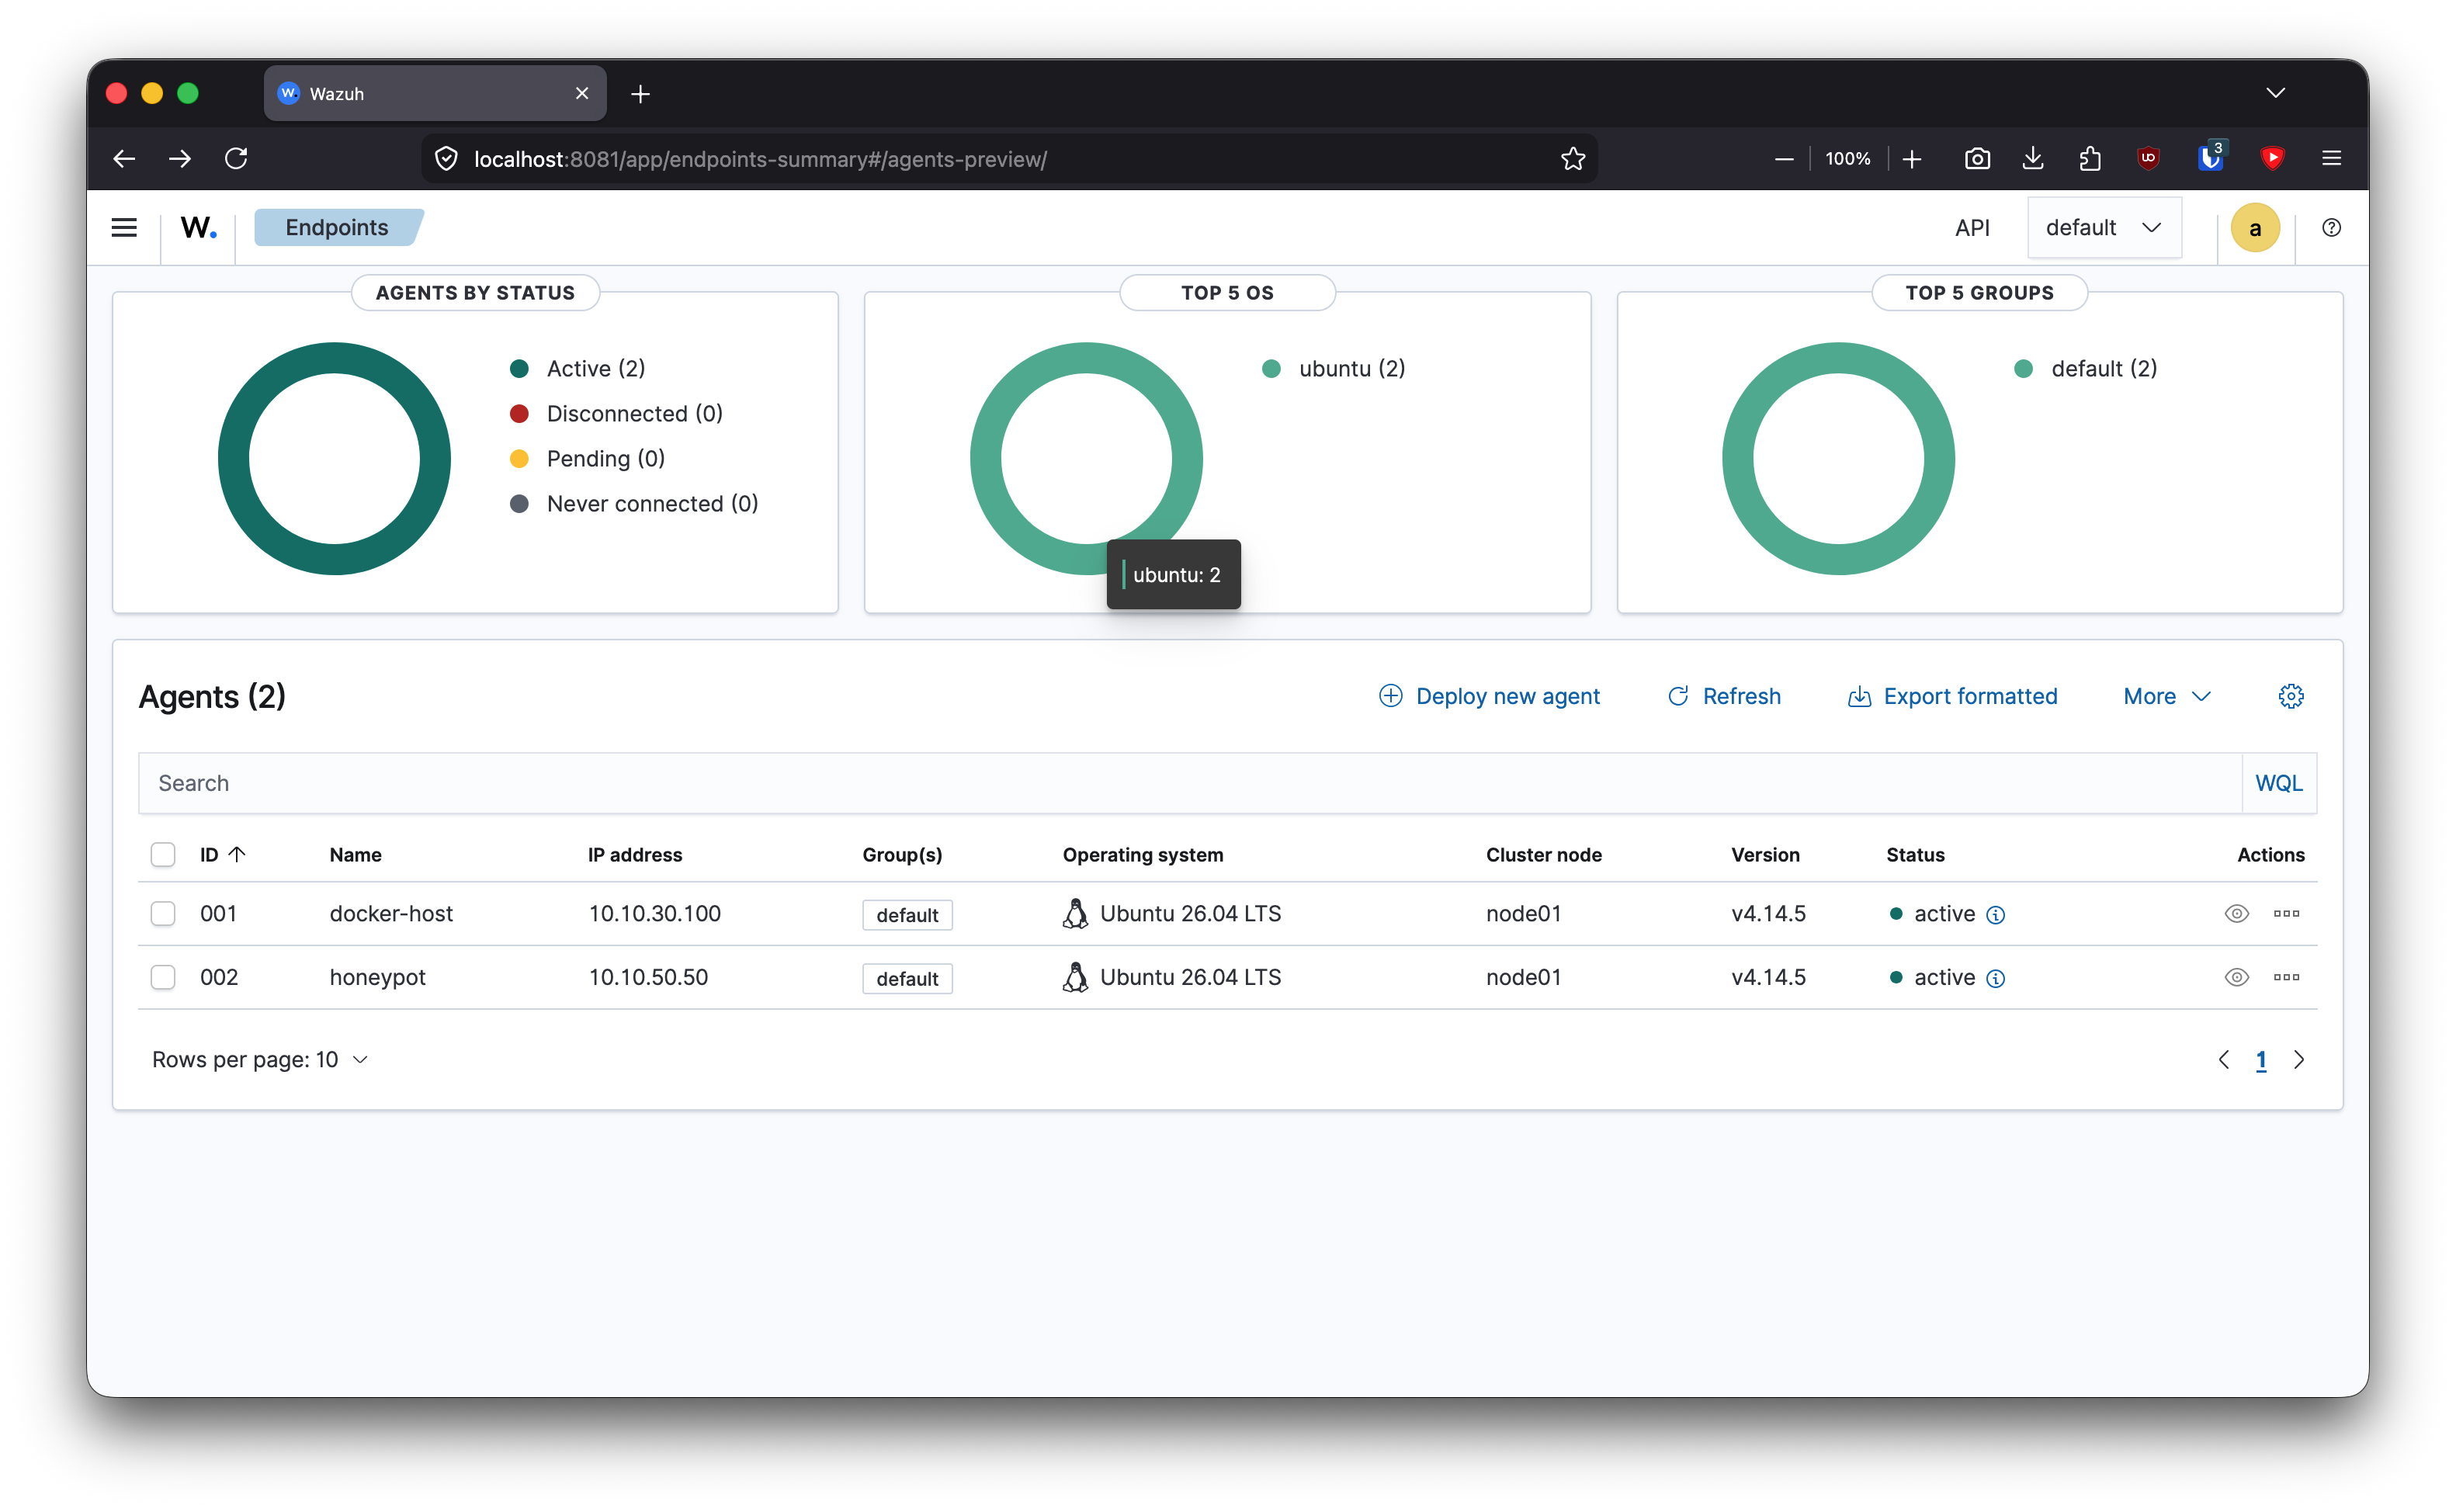
The Wazuh agent sees host activity, but the attack data is in T-Pot logs. I added Suricata’s eve.json as a JSON localfile.
Find the logs:
sudo find /home/honeypot/tpotce/data -name "*.json"
Add to the honeypot agent’s /var/ossec/etc/ossec.conf:
<localfile>
  <log_format>json</log_format>
  <location>/home/honeypot/tpotce/data/suricata/log/eve.json</location>
</localfile>
Restart the agent:
sudo systemctl restart wazuh-agent
Problems I Hit
Snort alerts existed but Wazuh showed nothing. The alert had to be sent to the pfSense system log, then decoded by Wazuh. The built-in decoder did not match the pfSense CSV format.
Searching for snort was the wrong query. The event existed, but the text did not contain the word snort. rule.id:100100 and decoder.name:snort-csv were the useful queries.
T-Pot Attack Map stayed empty for lab traffic. The source IP was private RFC1918 space, so the map did not geolocate it. The events were in Kibana/Wazuh; the visualization was filtering them.
What I Learned
An empty dashboard is not proof that data is absent. It may mean the event is not forwarded, not decoded, not indexed, or simply not queried correctly.
I also learned to treat visualizations as summaries, not ground truth. For internal lab attacks, raw event search by src_ip is more reliable than a world map designed for public internet sources.
Validation Evidence
Snort test:
curl http://testmynids.org/uid/index.html
Wazuh decoder test:
sudo /var/ossec/bin/wazuh-logtest
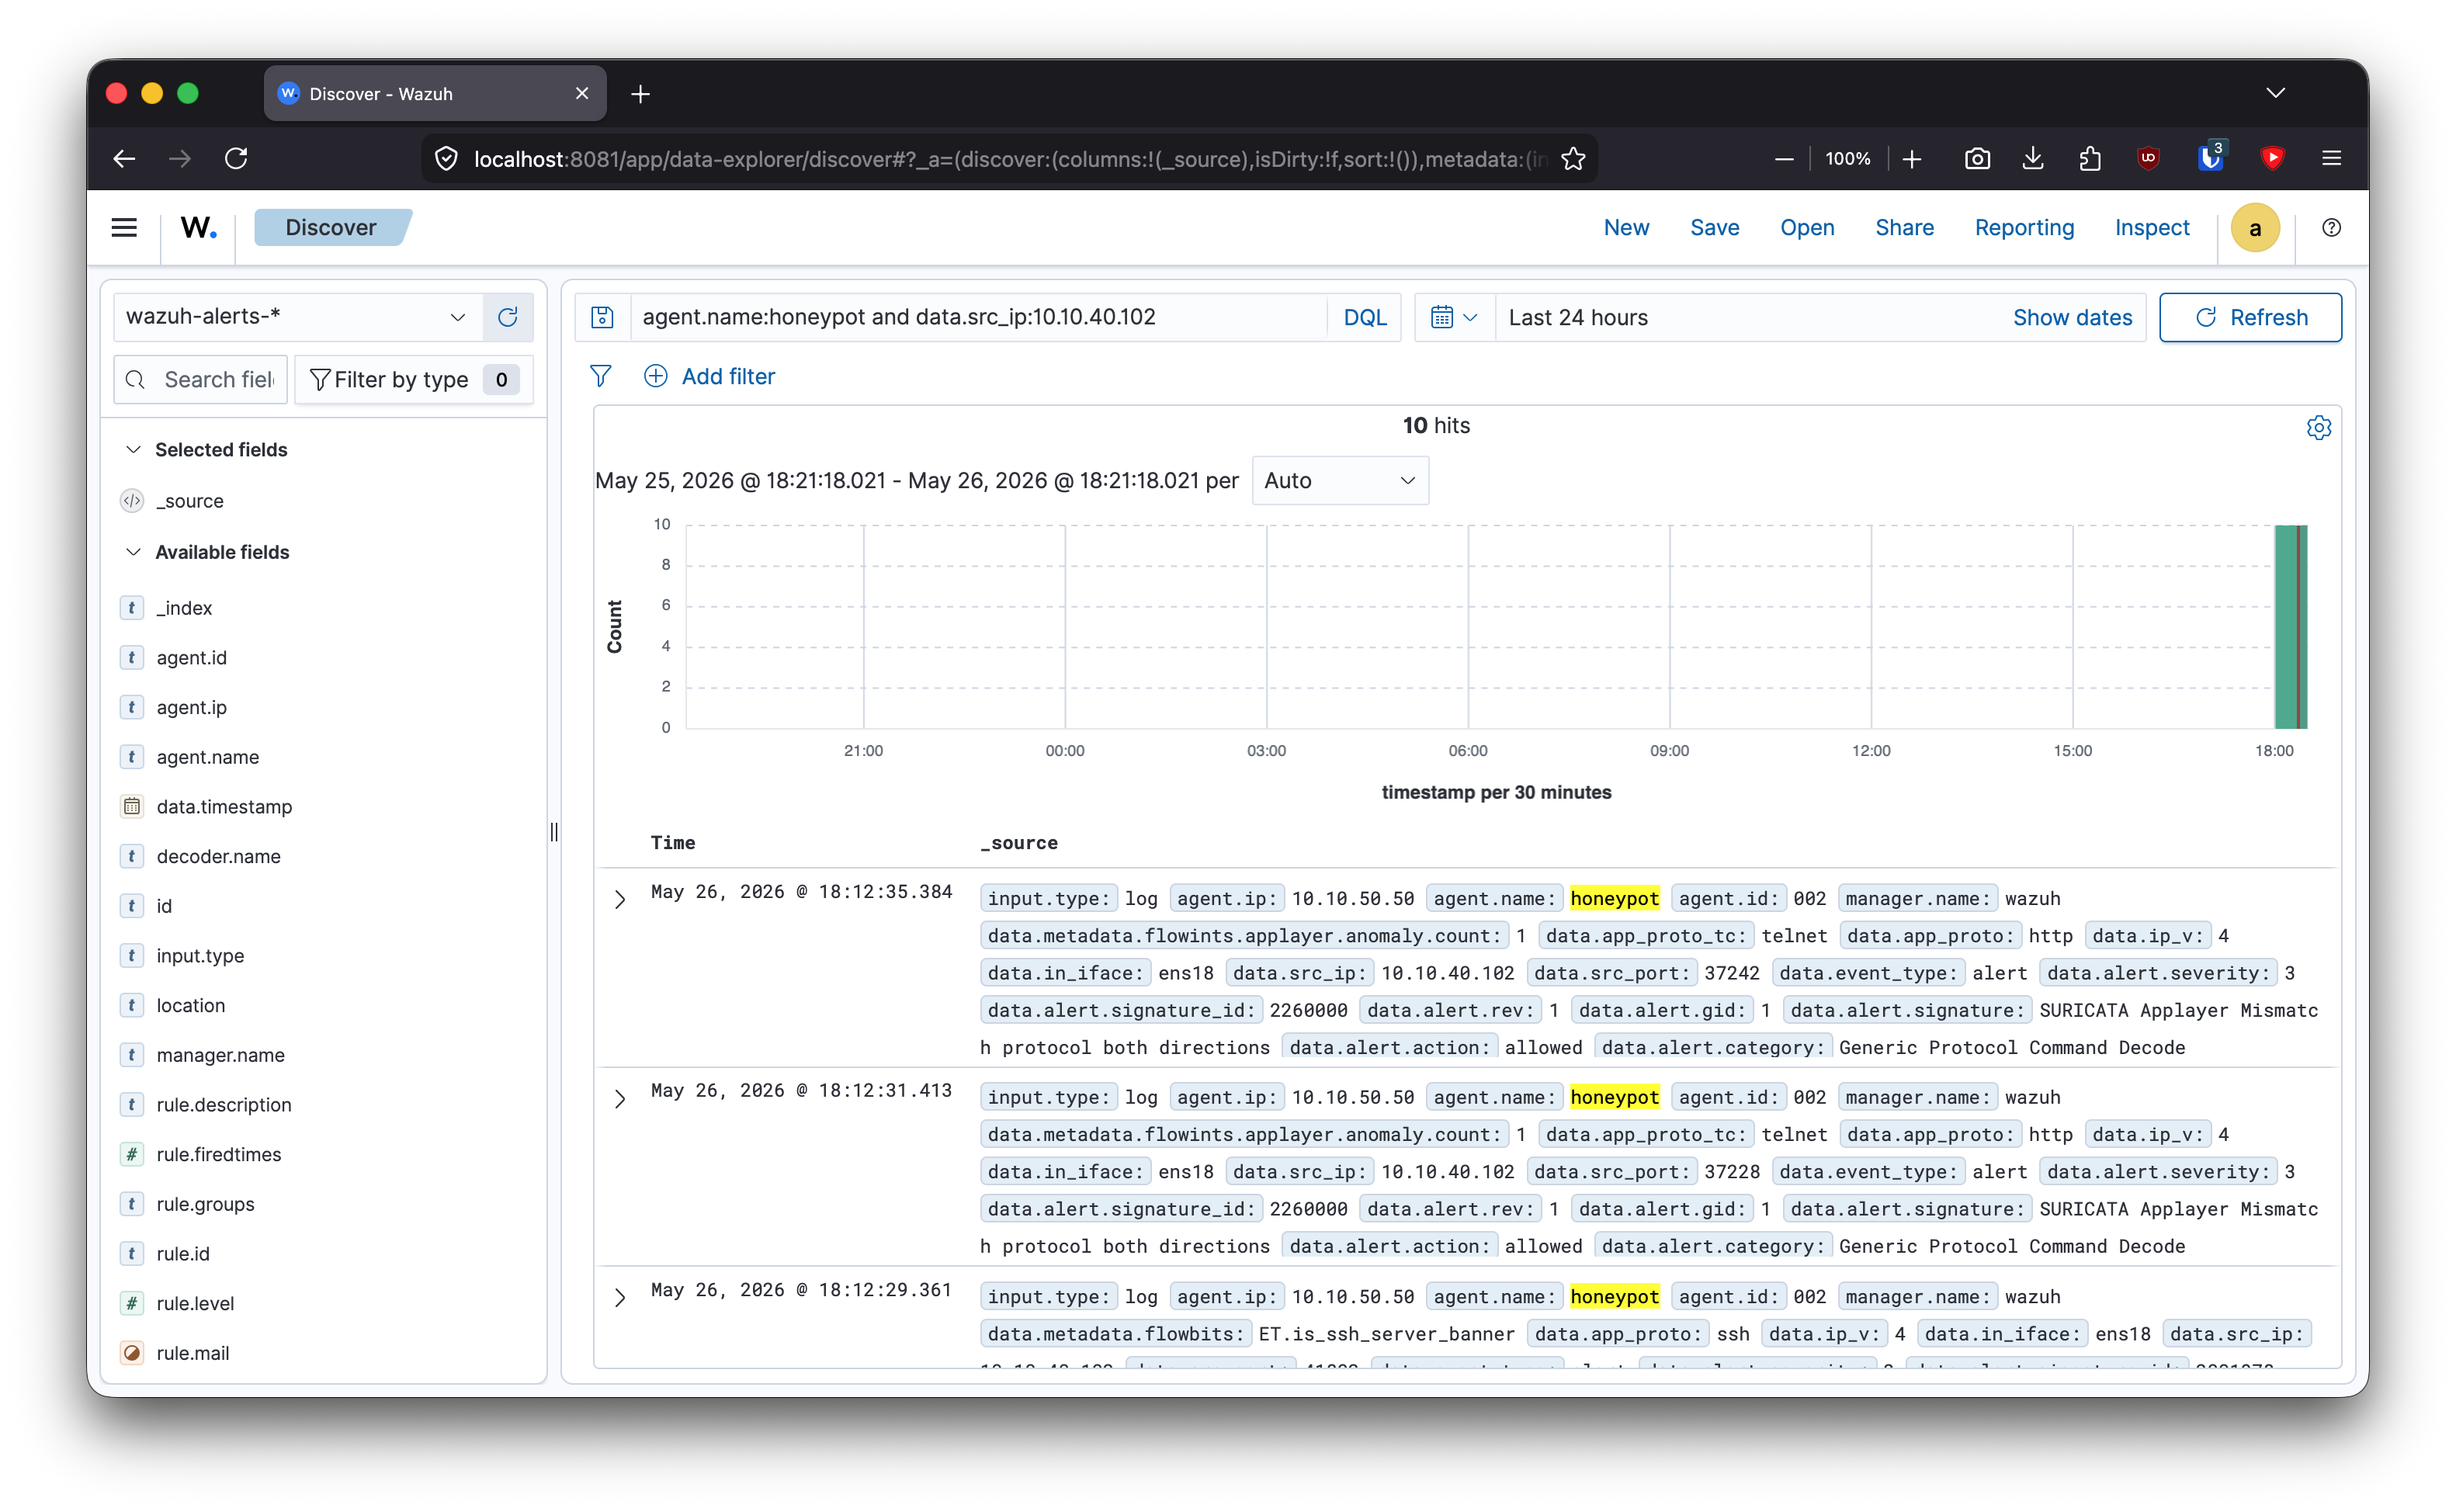
T-Pot test from Kali:
nmap -sV --top-ports 50 10.10.50.50
ssh root@10.10.50.50
Useful searches:
rule.id:100100
decoder.name:snort-csv
data.src_ip:10.10.40.102
agent.name:honeypot
What This Enables Next
The lab now has network IDS, honeypot telemetry, and a SIEM pipeline that can be debugged end to end. Next, I solve remote access cleanly because I need to manage the lab while away from home without exposing pfSense to the internet.
Quick Reference
<localfile>
  <log_format>json</log_format>
  <location>/home/honeypot/tpotce/data/suricata/log/eve.json</location>
</localfile>
sudo /var/ossec/bin/wazuh-logtest
curl http://testmynids.org/uid/index.html